Mongolian vs Northern European Median Female Earnings
COMPARE
Mongolian
Northern European
Median Female Earnings
Median Female Earnings Comparison
Mongolians
Northern Europeans
$42,542
MEDIAN FEMALE EARNINGS
99.7/ 100
METRIC RATING
73rd/ 347
METRIC RANK
$40,491
MEDIAN FEMALE EARNINGS
83.9/ 100
METRIC RATING
143rd/ 347
METRIC RANK
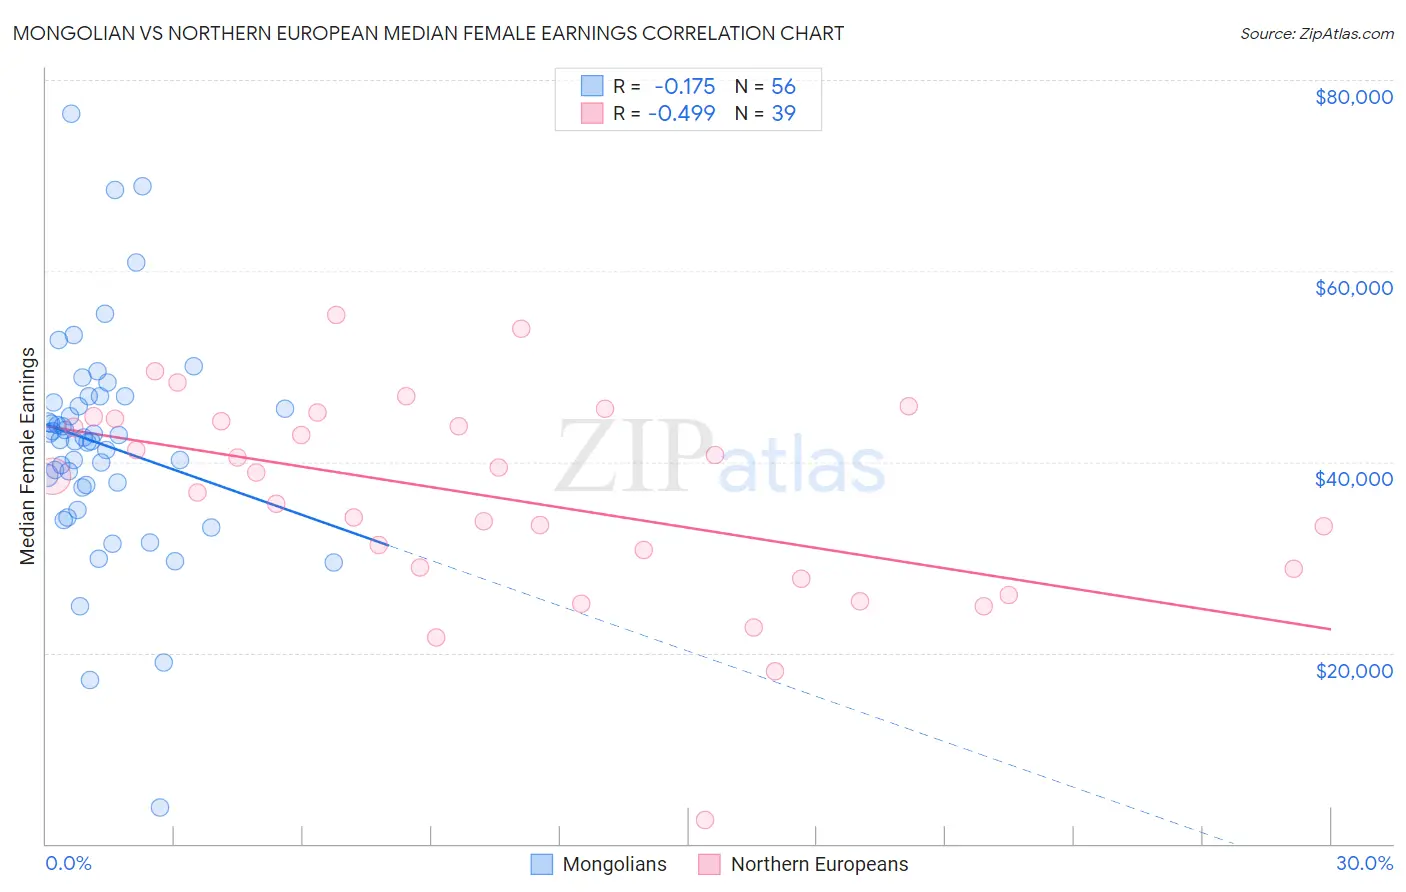
Mongolian vs Northern European Median Female Earnings Correlation Chart
The statistical analysis conducted on geographies consisting of 140,350,842 people shows a poor negative correlation between the proportion of Mongolians and median female earnings in the United States with a correlation coefficient (R) of -0.175 and weighted average of $42,542. Similarly, the statistical analysis conducted on geographies consisting of 405,763,139 people shows a moderate negative correlation between the proportion of Northern Europeans and median female earnings in the United States with a correlation coefficient (R) of -0.499 and weighted average of $40,491, a difference of 5.1%.
Median Female Earnings Correlation Summary
| Measurement | Mongolian | Northern European |
| Minimum | $3,764 | $2,499 |
| Maximum | $76,486 | $55,429 |
| Range | $72,722 | $52,930 |
| Mean | $41,823 | $36,265 |
| Median | $42,408 | $38,502 |
| Interquartile 25% (IQ1) | $37,469 | $28,750 |
| Interquartile 75% (IQ3) | $46,493 | $44,474 |
| Interquartile Range (IQR) | $9,024 | $15,724 |
| Standard Deviation (Sample) | $11,821 | $10,785 |
| Standard Deviation (Population) | $11,715 | $10,645 |
Similar Demographics by Median Female Earnings
Demographics Similar to Mongolians by Median Female Earnings
In terms of median female earnings, the demographic groups most similar to Mongolians are Immigrants from South Africa ($42,508, a difference of 0.080%), Albanian ($42,584, a difference of 0.10%), New Zealander ($42,446, a difference of 0.23%), Immigrants from Italy ($42,446, a difference of 0.23%), and Immigrants from Albania ($42,388, a difference of 0.36%).
| Demographics | Rating | Rank | Median Female Earnings |
| Immigrants | Norway | 99.9 /100 | #66 | Exceptional $42,837 |
| Immigrants | Egypt | 99.9 /100 | #67 | Exceptional $42,837 |
| Immigrants | Austria | 99.8 /100 | #68 | Exceptional $42,824 |
| Immigrants | Spain | 99.8 /100 | #69 | Exceptional $42,815 |
| Immigrants | Ethiopia | 99.8 /100 | #70 | Exceptional $42,744 |
| Immigrants | Romania | 99.8 /100 | #71 | Exceptional $42,718 |
| Albanians | 99.8 /100 | #72 | Exceptional $42,584 |
| Mongolians | 99.7 /100 | #73 | Exceptional $42,542 |
| Immigrants | South Africa | 99.7 /100 | #74 | Exceptional $42,508 |
| New Zealanders | 99.7 /100 | #75 | Exceptional $42,446 |
| Immigrants | Italy | 99.7 /100 | #76 | Exceptional $42,446 |
| Immigrants | Albania | 99.6 /100 | #77 | Exceptional $42,388 |
| Immigrants | Kazakhstan | 99.6 /100 | #78 | Exceptional $42,386 |
| Greeks | 99.6 /100 | #79 | Exceptional $42,336 |
| Immigrants | Moldova | 99.6 /100 | #80 | Exceptional $42,304 |
Demographics Similar to Northern Europeans by Median Female Earnings
In terms of median female earnings, the demographic groups most similar to Northern Europeans are Sri Lankan ($40,496, a difference of 0.010%), Immigrants from North Macedonia ($40,488, a difference of 0.010%), Immigrants from Syria ($40,499, a difference of 0.020%), Brazilian ($40,483, a difference of 0.020%), and Serbian ($40,539, a difference of 0.12%).
| Demographics | Rating | Rank | Median Female Earnings |
| Immigrants | Eastern Africa | 87.7 /100 | #136 | Excellent $40,644 |
| Pakistanis | 86.6 /100 | #137 | Excellent $40,596 |
| Taiwanese | 86.1 /100 | #138 | Excellent $40,576 |
| Immigrants | South Eastern Asia | 85.7 /100 | #139 | Excellent $40,558 |
| Serbians | 85.2 /100 | #140 | Excellent $40,539 |
| Immigrants | Syria | 84.1 /100 | #141 | Excellent $40,499 |
| Sri Lankans | 84.0 /100 | #142 | Excellent $40,496 |
| Northern Europeans | 83.9 /100 | #143 | Excellent $40,491 |
| Immigrants | North Macedonia | 83.8 /100 | #144 | Excellent $40,488 |
| Brazilians | 83.6 /100 | #145 | Excellent $40,483 |
| Ghanaians | 82.1 /100 | #146 | Excellent $40,429 |
| Vietnamese | 80.4 /100 | #147 | Excellent $40,377 |
| Poles | 80.2 /100 | #148 | Excellent $40,371 |
| Immigrants | Cameroon | 79.7 /100 | #149 | Good $40,354 |
| Immigrants | Chile | 79.6 /100 | #150 | Good $40,353 |