Mongolian vs Immigrants from Guatemala Median Female Earnings
COMPARE
Mongolian
Immigrants from Guatemala
Median Female Earnings
Median Female Earnings Comparison
Mongolians
Immigrants from Guatemala
$42,542
MEDIAN FEMALE EARNINGS
99.7/ 100
METRIC RATING
73rd/ 347
METRIC RANK
$35,444
MEDIAN FEMALE EARNINGS
0.0/ 100
METRIC RATING
299th/ 347
METRIC RANK
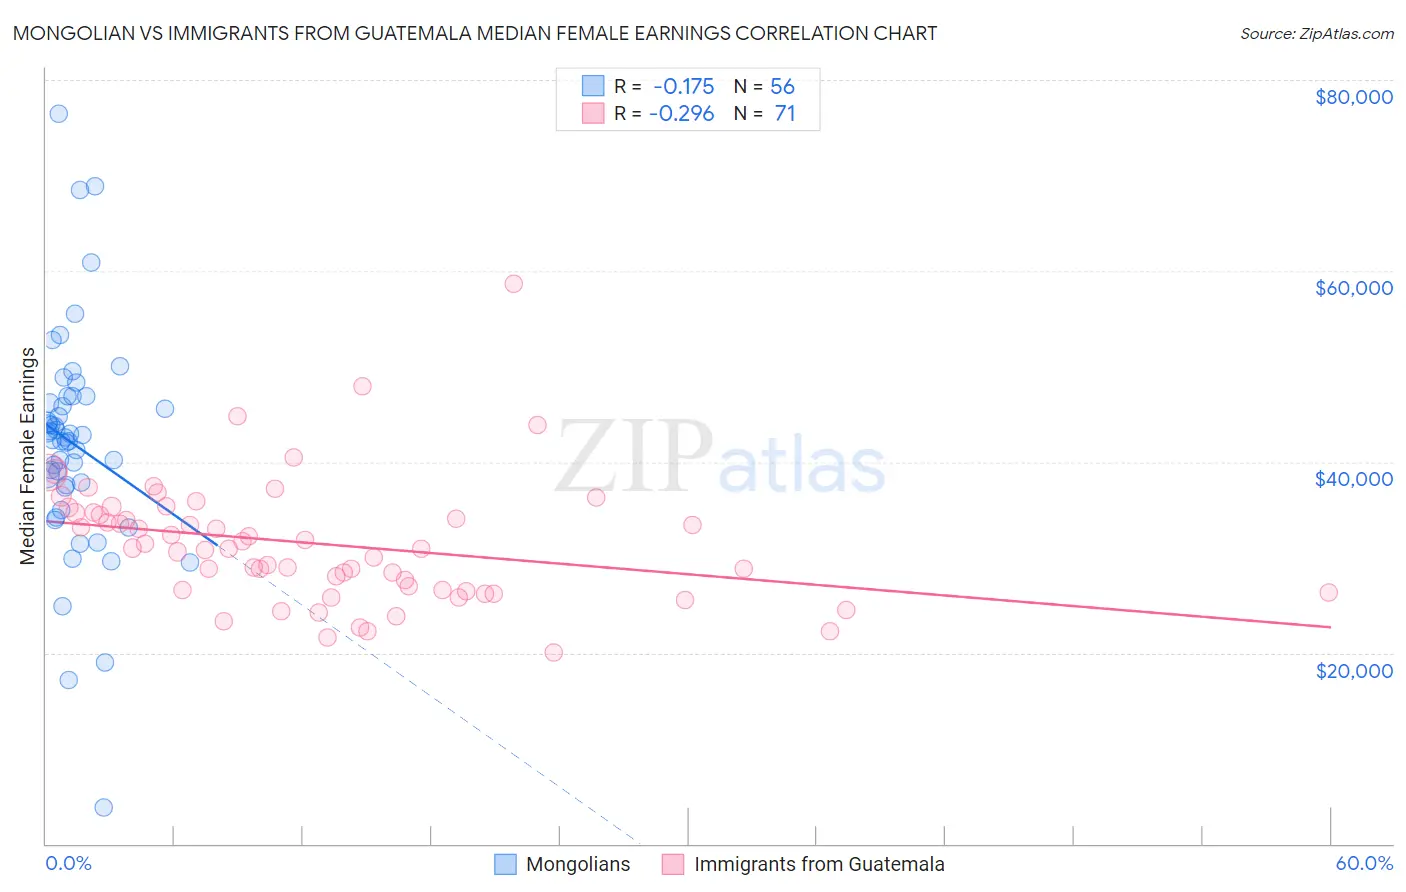
Mongolian vs Immigrants from Guatemala Median Female Earnings Correlation Chart
The statistical analysis conducted on geographies consisting of 140,350,842 people shows a poor negative correlation between the proportion of Mongolians and median female earnings in the United States with a correlation coefficient (R) of -0.175 and weighted average of $42,542. Similarly, the statistical analysis conducted on geographies consisting of 377,157,500 people shows a weak negative correlation between the proportion of Immigrants from Guatemala and median female earnings in the United States with a correlation coefficient (R) of -0.296 and weighted average of $35,444, a difference of 20.0%.
Median Female Earnings Correlation Summary
| Measurement | Mongolian | Immigrants from Guatemala |
| Minimum | $3,764 | $20,000 |
| Maximum | $76,486 | $58,669 |
| Range | $72,722 | $38,669 |
| Mean | $41,823 | $31,424 |
| Median | $42,408 | $30,854 |
| Interquartile 25% (IQ1) | $37,469 | $26,583 |
| Interquartile 75% (IQ3) | $46,493 | $34,723 |
| Interquartile Range (IQR) | $9,024 | $8,140 |
| Standard Deviation (Sample) | $11,821 | $6,504 |
| Standard Deviation (Population) | $11,715 | $6,458 |
Similar Demographics by Median Female Earnings
Demographics Similar to Mongolians by Median Female Earnings
In terms of median female earnings, the demographic groups most similar to Mongolians are Immigrants from South Africa ($42,508, a difference of 0.080%), Albanian ($42,584, a difference of 0.10%), New Zealander ($42,446, a difference of 0.23%), Immigrants from Italy ($42,446, a difference of 0.23%), and Immigrants from Albania ($42,388, a difference of 0.36%).
| Demographics | Rating | Rank | Median Female Earnings |
| Immigrants | Norway | 99.9 /100 | #66 | Exceptional $42,837 |
| Immigrants | Egypt | 99.9 /100 | #67 | Exceptional $42,837 |
| Immigrants | Austria | 99.8 /100 | #68 | Exceptional $42,824 |
| Immigrants | Spain | 99.8 /100 | #69 | Exceptional $42,815 |
| Immigrants | Ethiopia | 99.8 /100 | #70 | Exceptional $42,744 |
| Immigrants | Romania | 99.8 /100 | #71 | Exceptional $42,718 |
| Albanians | 99.8 /100 | #72 | Exceptional $42,584 |
| Mongolians | 99.7 /100 | #73 | Exceptional $42,542 |
| Immigrants | South Africa | 99.7 /100 | #74 | Exceptional $42,508 |
| New Zealanders | 99.7 /100 | #75 | Exceptional $42,446 |
| Immigrants | Italy | 99.7 /100 | #76 | Exceptional $42,446 |
| Immigrants | Albania | 99.6 /100 | #77 | Exceptional $42,388 |
| Immigrants | Kazakhstan | 99.6 /100 | #78 | Exceptional $42,386 |
| Greeks | 99.6 /100 | #79 | Exceptional $42,336 |
| Immigrants | Moldova | 99.6 /100 | #80 | Exceptional $42,304 |
Demographics Similar to Immigrants from Guatemala by Median Female Earnings
In terms of median female earnings, the demographic groups most similar to Immigrants from Guatemala are Immigrants from Micronesia ($35,477, a difference of 0.090%), Hmong ($35,498, a difference of 0.15%), Yuman ($35,377, a difference of 0.19%), Pima ($35,326, a difference of 0.33%), and Black/African American ($35,315, a difference of 0.36%).
| Demographics | Rating | Rank | Median Female Earnings |
| Americans | 0.0 /100 | #292 | Tragic $35,777 |
| Guatemalans | 0.0 /100 | #293 | Tragic $35,695 |
| Cheyenne | 0.0 /100 | #294 | Tragic $35,673 |
| Comanche | 0.0 /100 | #295 | Tragic $35,661 |
| Mexican American Indians | 0.0 /100 | #296 | Tragic $35,629 |
| Hmong | 0.0 /100 | #297 | Tragic $35,498 |
| Immigrants | Micronesia | 0.0 /100 | #298 | Tragic $35,477 |
| Immigrants | Guatemala | 0.0 /100 | #299 | Tragic $35,444 |
| Yuman | 0.0 /100 | #300 | Tragic $35,377 |
| Pima | 0.0 /100 | #301 | Tragic $35,326 |
| Blacks/African Americans | 0.0 /100 | #302 | Tragic $35,315 |
| Immigrants | Latin America | 0.0 /100 | #303 | Tragic $35,307 |
| Crow | 0.0 /100 | #304 | Tragic $35,266 |
| Bahamians | 0.0 /100 | #305 | Tragic $35,125 |
| Fijians | 0.0 /100 | #306 | Tragic $35,114 |