Mongolian vs Cree Median Female Earnings
COMPARE
Mongolian
Cree
Median Female Earnings
Median Female Earnings Comparison
Mongolians
Cree
$42,542
MEDIAN FEMALE EARNINGS
99.7/ 100
METRIC RATING
73rd/ 347
METRIC RANK
$37,018
MEDIAN FEMALE EARNINGS
0.4/ 100
METRIC RATING
268th/ 347
METRIC RANK
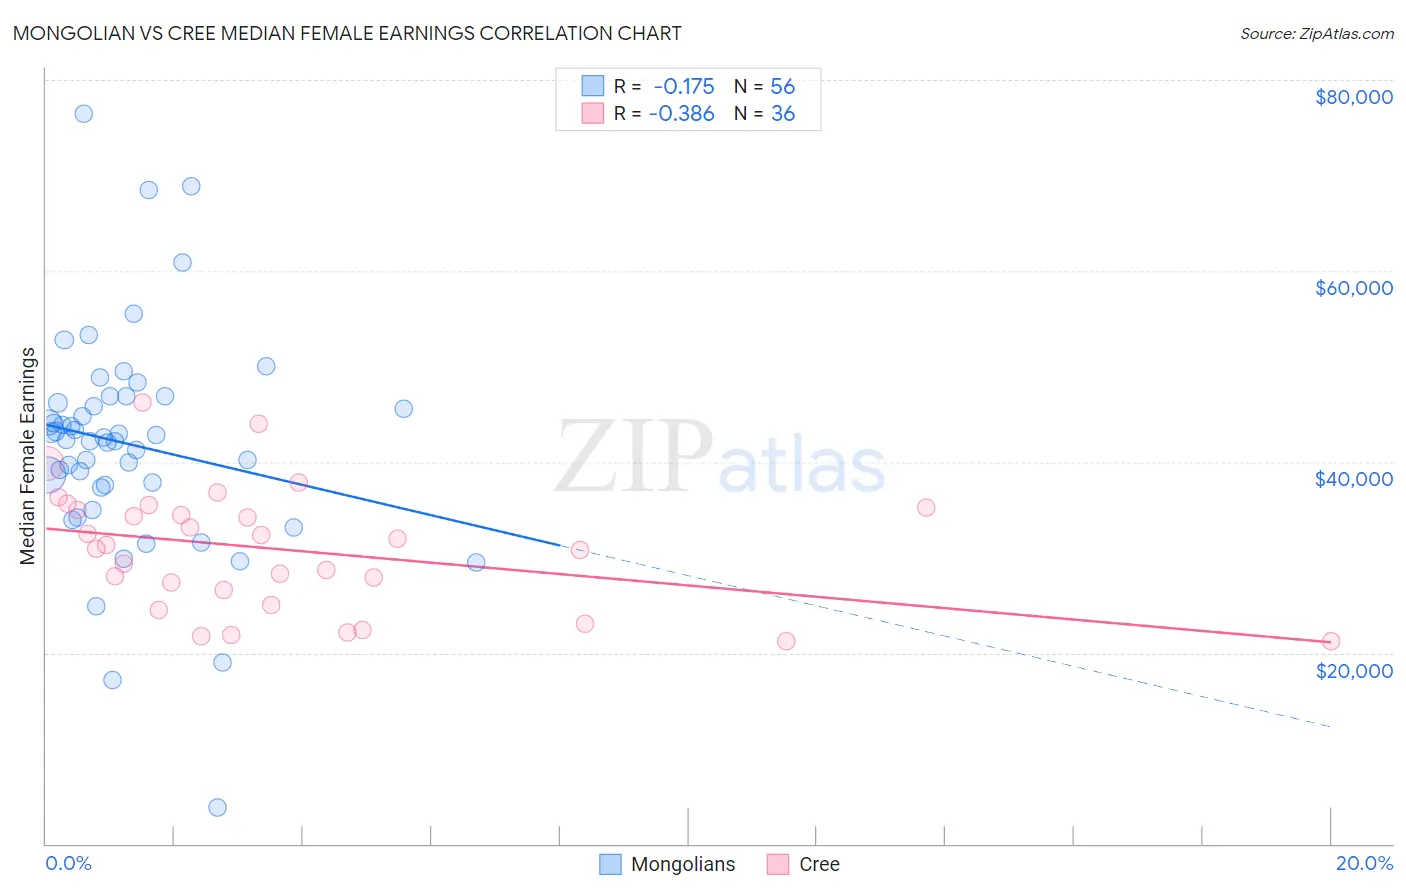
Mongolian vs Cree Median Female Earnings Correlation Chart
The statistical analysis conducted on geographies consisting of 140,350,842 people shows a poor negative correlation between the proportion of Mongolians and median female earnings in the United States with a correlation coefficient (R) of -0.175 and weighted average of $42,542. Similarly, the statistical analysis conducted on geographies consisting of 76,188,527 people shows a mild negative correlation between the proportion of Cree and median female earnings in the United States with a correlation coefficient (R) of -0.386 and weighted average of $37,018, a difference of 14.9%.
Median Female Earnings Correlation Summary
| Measurement | Mongolian | Cree |
| Minimum | $3,764 | $21,250 |
| Maximum | $76,486 | $46,168 |
| Range | $72,722 | $24,918 |
| Mean | $41,823 | $30,765 |
| Median | $42,408 | $31,124 |
| Interquartile 25% (IQ1) | $37,469 | $25,810 |
| Interquartile 75% (IQ3) | $46,493 | $35,030 |
| Interquartile Range (IQR) | $9,024 | $9,221 |
| Standard Deviation (Sample) | $11,821 | $6,370 |
| Standard Deviation (Population) | $11,715 | $6,281 |
Similar Demographics by Median Female Earnings
Demographics Similar to Mongolians by Median Female Earnings
In terms of median female earnings, the demographic groups most similar to Mongolians are Immigrants from South Africa ($42,508, a difference of 0.080%), Albanian ($42,584, a difference of 0.10%), New Zealander ($42,446, a difference of 0.23%), Immigrants from Italy ($42,446, a difference of 0.23%), and Immigrants from Albania ($42,388, a difference of 0.36%).
| Demographics | Rating | Rank | Median Female Earnings |
| Immigrants | Norway | 99.9 /100 | #66 | Exceptional $42,837 |
| Immigrants | Egypt | 99.9 /100 | #67 | Exceptional $42,837 |
| Immigrants | Austria | 99.8 /100 | #68 | Exceptional $42,824 |
| Immigrants | Spain | 99.8 /100 | #69 | Exceptional $42,815 |
| Immigrants | Ethiopia | 99.8 /100 | #70 | Exceptional $42,744 |
| Immigrants | Romania | 99.8 /100 | #71 | Exceptional $42,718 |
| Albanians | 99.8 /100 | #72 | Exceptional $42,584 |
| Mongolians | 99.7 /100 | #73 | Exceptional $42,542 |
| Immigrants | South Africa | 99.7 /100 | #74 | Exceptional $42,508 |
| New Zealanders | 99.7 /100 | #75 | Exceptional $42,446 |
| Immigrants | Italy | 99.7 /100 | #76 | Exceptional $42,446 |
| Immigrants | Albania | 99.6 /100 | #77 | Exceptional $42,388 |
| Immigrants | Kazakhstan | 99.6 /100 | #78 | Exceptional $42,386 |
| Greeks | 99.6 /100 | #79 | Exceptional $42,336 |
| Immigrants | Moldova | 99.6 /100 | #80 | Exceptional $42,304 |
Demographics Similar to Cree by Median Female Earnings
In terms of median female earnings, the demographic groups most similar to Cree are Nonimmigrants ($37,024, a difference of 0.010%), Immigrants from Venezuela ($37,003, a difference of 0.040%), Dominican ($37,046, a difference of 0.070%), Immigrants from Belize ($37,056, a difference of 0.10%), and Salvadoran ($37,083, a difference of 0.18%).
| Demographics | Rating | Rank | Median Female Earnings |
| Malaysians | 0.7 /100 | #261 | Tragic $37,298 |
| Venezuelans | 0.7 /100 | #262 | Tragic $37,282 |
| German Russians | 0.5 /100 | #263 | Tragic $37,105 |
| Salvadorans | 0.4 /100 | #264 | Tragic $37,083 |
| Immigrants | Belize | 0.4 /100 | #265 | Tragic $37,056 |
| Dominicans | 0.4 /100 | #266 | Tragic $37,046 |
| Immigrants | Nonimmigrants | 0.4 /100 | #267 | Tragic $37,024 |
| Cree | 0.4 /100 | #268 | Tragic $37,018 |
| Immigrants | Venezuela | 0.4 /100 | #269 | Tragic $37,003 |
| French American Indians | 0.3 /100 | #270 | Tragic $36,920 |
| Nicaraguans | 0.3 /100 | #271 | Tragic $36,904 |
| Immigrants | Dominican Republic | 0.3 /100 | #272 | Tragic $36,857 |
| Immigrants | Laos | 0.3 /100 | #273 | Tragic $36,841 |
| Immigrants | El Salvador | 0.2 /100 | #274 | Tragic $36,673 |
| Africans | 0.1 /100 | #275 | Tragic $36,530 |