Mexican vs Immigrants from Guyana Median Earnings
COMPARE
Mexican
Immigrants from Guyana
Median Earnings
Median Earnings Comparison
Mexicans
Immigrants from Guyana
$39,834
MEDIAN EARNINGS
0.0/ 100
METRIC RATING
321st/ 347
METRIC RANK
$45,204
MEDIAN EARNINGS
15.1/ 100
METRIC RATING
221st/ 347
METRIC RANK
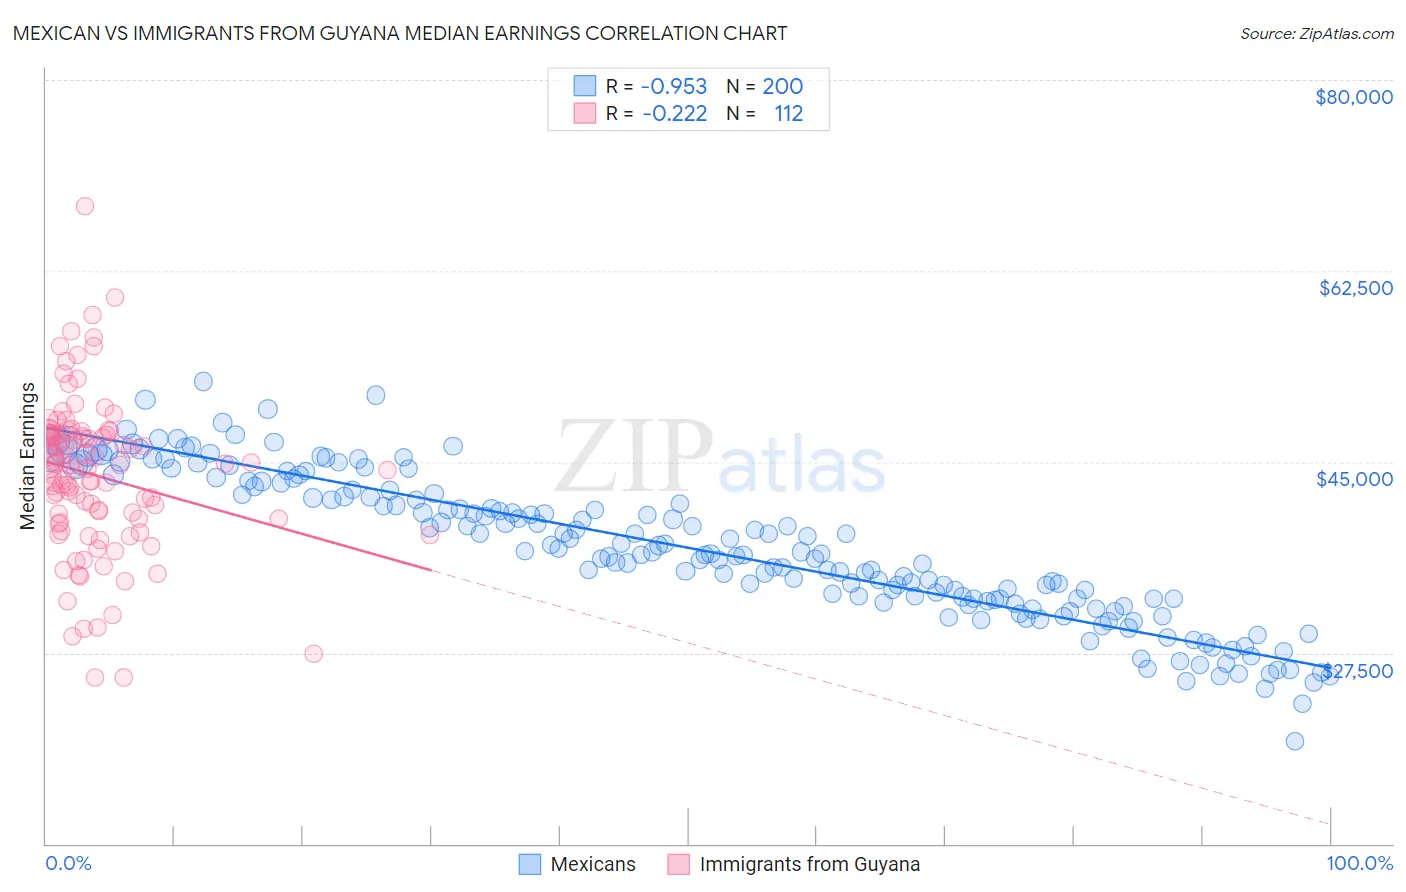
Mexican vs Immigrants from Guyana Median Earnings Correlation Chart
The statistical analysis conducted on geographies consisting of 564,951,151 people shows a perfect negative correlation between the proportion of Mexicans and median earnings in the United States with a correlation coefficient (R) of -0.953 and weighted average of $39,834. Similarly, the statistical analysis conducted on geographies consisting of 183,726,948 people shows a weak negative correlation between the proportion of Immigrants from Guyana and median earnings in the United States with a correlation coefficient (R) of -0.222 and weighted average of $45,204, a difference of 13.5%.
Median Earnings Correlation Summary
| Measurement | Mexican | Immigrants from Guyana |
| Minimum | $19,356 | $25,266 |
| Maximum | $52,379 | $68,439 |
| Range | $33,023 | $43,174 |
| Mean | $37,116 | $43,730 |
| Median | $36,764 | $44,540 |
| Interquartile 25% (IQ1) | $32,451 | $39,599 |
| Interquartile 75% (IQ3) | $42,421 | $47,563 |
| Interquartile Range (IQR) | $9,971 | $7,964 |
| Standard Deviation (Sample) | $6,683 | $7,179 |
| Standard Deviation (Population) | $6,666 | $7,147 |
Similar Demographics by Median Earnings
Demographics Similar to Mexicans by Median Earnings
In terms of median earnings, the demographic groups most similar to Mexicans are Immigrants from Bahamas ($39,861, a difference of 0.070%), Immigrants from Central America ($39,762, a difference of 0.18%), Bahamian ($39,735, a difference of 0.25%), Ottawa ($39,721, a difference of 0.29%), and Creek ($39,648, a difference of 0.47%).
| Demographics | Rating | Rank | Median Earnings |
| Cheyenne | 0.0 /100 | #314 | Tragic $40,233 |
| Seminole | 0.0 /100 | #315 | Tragic $40,233 |
| Immigrants | Honduras | 0.0 /100 | #316 | Tragic $40,195 |
| Fijians | 0.0 /100 | #317 | Tragic $40,193 |
| Dutch West Indians | 0.0 /100 | #318 | Tragic $40,107 |
| Blacks/African Americans | 0.0 /100 | #319 | Tragic $40,085 |
| Immigrants | Bahamas | 0.0 /100 | #320 | Tragic $39,861 |
| Mexicans | 0.0 /100 | #321 | Tragic $39,834 |
| Immigrants | Central America | 0.0 /100 | #322 | Tragic $39,762 |
| Bahamians | 0.0 /100 | #323 | Tragic $39,735 |
| Ottawa | 0.0 /100 | #324 | Tragic $39,721 |
| Creek | 0.0 /100 | #325 | Tragic $39,648 |
| Immigrants | Yemen | 0.0 /100 | #326 | Tragic $39,540 |
| Yuman | 0.0 /100 | #327 | Tragic $39,523 |
| Sioux | 0.0 /100 | #328 | Tragic $39,448 |
Demographics Similar to Immigrants from Guyana by Median Earnings
In terms of median earnings, the demographic groups most similar to Immigrants from Guyana are Immigrants from Panama ($45,198, a difference of 0.010%), Ecuadorian ($45,214, a difference of 0.020%), White/Caucasian ($45,197, a difference of 0.020%), West Indian ($45,132, a difference of 0.16%), and Immigrants from Cambodia ($45,090, a difference of 0.25%).
| Demographics | Rating | Rank | Median Earnings |
| Nigerians | 22.0 /100 | #214 | Fair $45,532 |
| Immigrants | Bangladesh | 22.0 /100 | #215 | Fair $45,532 |
| Guyanese | 20.6 /100 | #216 | Fair $45,470 |
| Tlingit-Haida | 20.5 /100 | #217 | Fair $45,468 |
| Spanish | 19.7 /100 | #218 | Poor $45,432 |
| Dutch | 18.4 /100 | #219 | Poor $45,370 |
| Ecuadorians | 15.3 /100 | #220 | Poor $45,214 |
| Immigrants | Guyana | 15.1 /100 | #221 | Poor $45,204 |
| Immigrants | Panama | 15.0 /100 | #222 | Poor $45,198 |
| Whites/Caucasians | 15.0 /100 | #223 | Poor $45,197 |
| West Indians | 13.9 /100 | #224 | Poor $45,132 |
| Immigrants | Cambodia | 13.2 /100 | #225 | Poor $45,090 |
| Immigrants | Nigeria | 12.2 /100 | #226 | Poor $45,030 |
| Native Hawaiians | 12.2 /100 | #227 | Poor $45,027 |
| Immigrants | Iraq | 11.6 /100 | #228 | Poor $44,988 |