Immigrants from Taiwan vs Immigrants from Guyana Median Earnings
COMPARE
Immigrants from Taiwan
Immigrants from Guyana
Median Earnings
Median Earnings Comparison
Immigrants from Taiwan
Immigrants from Guyana
$61,151
MEDIAN EARNINGS
100.0/ 100
METRIC RATING
2nd/ 347
METRIC RANK
$45,204
MEDIAN EARNINGS
15.1/ 100
METRIC RATING
221st/ 347
METRIC RANK
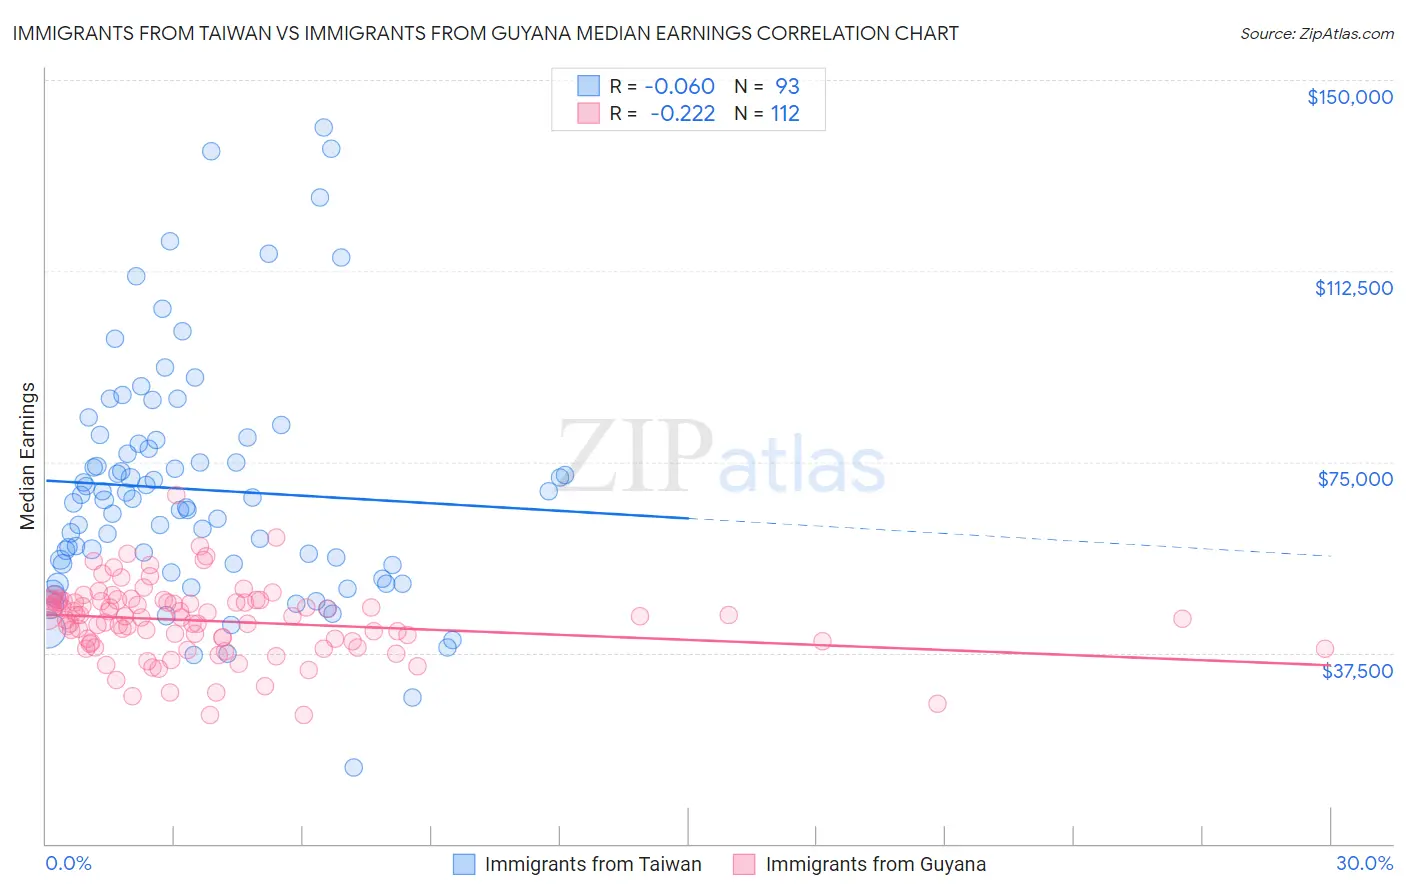
Immigrants from Taiwan vs Immigrants from Guyana Median Earnings Correlation Chart
The statistical analysis conducted on geographies consisting of 298,281,567 people shows a slight negative correlation between the proportion of Immigrants from Taiwan and median earnings in the United States with a correlation coefficient (R) of -0.060 and weighted average of $61,151. Similarly, the statistical analysis conducted on geographies consisting of 183,726,948 people shows a weak negative correlation between the proportion of Immigrants from Guyana and median earnings in the United States with a correlation coefficient (R) of -0.222 and weighted average of $45,204, a difference of 35.3%.
Median Earnings Correlation Summary
| Measurement | Immigrants from Taiwan | Immigrants from Guyana |
| Minimum | $15,000 | $25,266 |
| Maximum | $140,742 | $68,439 |
| Range | $125,742 | $43,174 |
| Mean | $69,540 | $43,730 |
| Median | $67,496 | $44,540 |
| Interquartile 25% (IQ1) | $54,032 | $39,599 |
| Interquartile 75% (IQ3) | $78,915 | $47,563 |
| Interquartile Range (IQR) | $24,883 | $7,964 |
| Standard Deviation (Sample) | $23,624 | $7,179 |
| Standard Deviation (Population) | $23,497 | $7,147 |
Similar Demographics by Median Earnings
Demographics Similar to Immigrants from Taiwan by Median Earnings
In terms of median earnings, the demographic groups most similar to Immigrants from Taiwan are Filipino ($61,197, a difference of 0.080%), Immigrants from India ($60,648, a difference of 0.83%), Immigrants from Hong Kong ($59,433, a difference of 2.9%), Thai ($59,237, a difference of 3.2%), and Immigrants from Singapore ($59,038, a difference of 3.6%).
| Demographics | Rating | Rank | Median Earnings |
| Filipinos | 100.0 /100 | #1 | Exceptional $61,197 |
| Immigrants | Taiwan | 100.0 /100 | #2 | Exceptional $61,151 |
| Immigrants | India | 100.0 /100 | #3 | Exceptional $60,648 |
| Immigrants | Hong Kong | 100.0 /100 | #4 | Exceptional $59,433 |
| Thais | 100.0 /100 | #5 | Exceptional $59,237 |
| Immigrants | Singapore | 100.0 /100 | #6 | Exceptional $59,038 |
| Iranians | 100.0 /100 | #7 | Exceptional $58,474 |
| Immigrants | Iran | 100.0 /100 | #8 | Exceptional $57,612 |
| Okinawans | 100.0 /100 | #9 | Exceptional $57,550 |
| Immigrants | South Central Asia | 100.0 /100 | #10 | Exceptional $57,114 |
| Immigrants | Israel | 100.0 /100 | #11 | Exceptional $57,034 |
| Immigrants | Ireland | 100.0 /100 | #12 | Exceptional $56,854 |
| Immigrants | China | 100.0 /100 | #13 | Exceptional $56,638 |
| Immigrants | Australia | 100.0 /100 | #14 | Exceptional $56,305 |
| Indians (Asian) | 100.0 /100 | #15 | Exceptional $56,253 |
Demographics Similar to Immigrants from Guyana by Median Earnings
In terms of median earnings, the demographic groups most similar to Immigrants from Guyana are Immigrants from Panama ($45,198, a difference of 0.010%), Ecuadorian ($45,214, a difference of 0.020%), White/Caucasian ($45,197, a difference of 0.020%), West Indian ($45,132, a difference of 0.16%), and Immigrants from Cambodia ($45,090, a difference of 0.25%).
| Demographics | Rating | Rank | Median Earnings |
| Nigerians | 22.0 /100 | #214 | Fair $45,532 |
| Immigrants | Bangladesh | 22.0 /100 | #215 | Fair $45,532 |
| Guyanese | 20.6 /100 | #216 | Fair $45,470 |
| Tlingit-Haida | 20.5 /100 | #217 | Fair $45,468 |
| Spanish | 19.7 /100 | #218 | Poor $45,432 |
| Dutch | 18.4 /100 | #219 | Poor $45,370 |
| Ecuadorians | 15.3 /100 | #220 | Poor $45,214 |
| Immigrants | Guyana | 15.1 /100 | #221 | Poor $45,204 |
| Immigrants | Panama | 15.0 /100 | #222 | Poor $45,198 |
| Whites/Caucasians | 15.0 /100 | #223 | Poor $45,197 |
| West Indians | 13.9 /100 | #224 | Poor $45,132 |
| Immigrants | Cambodia | 13.2 /100 | #225 | Poor $45,090 |
| Immigrants | Nigeria | 12.2 /100 | #226 | Poor $45,030 |
| Native Hawaiians | 12.2 /100 | #227 | Poor $45,027 |
| Immigrants | Iraq | 11.6 /100 | #228 | Poor $44,988 |