Subsaharan African vs Immigrants from Guyana Median Earnings
COMPARE
Subsaharan African
Immigrants from Guyana
Median Earnings
Median Earnings Comparison
Sub-Saharan Africans
Immigrants from Guyana
$44,118
MEDIAN EARNINGS
3.7/ 100
METRIC RATING
243rd/ 347
METRIC RANK
$45,204
MEDIAN EARNINGS
15.1/ 100
METRIC RATING
221st/ 347
METRIC RANK
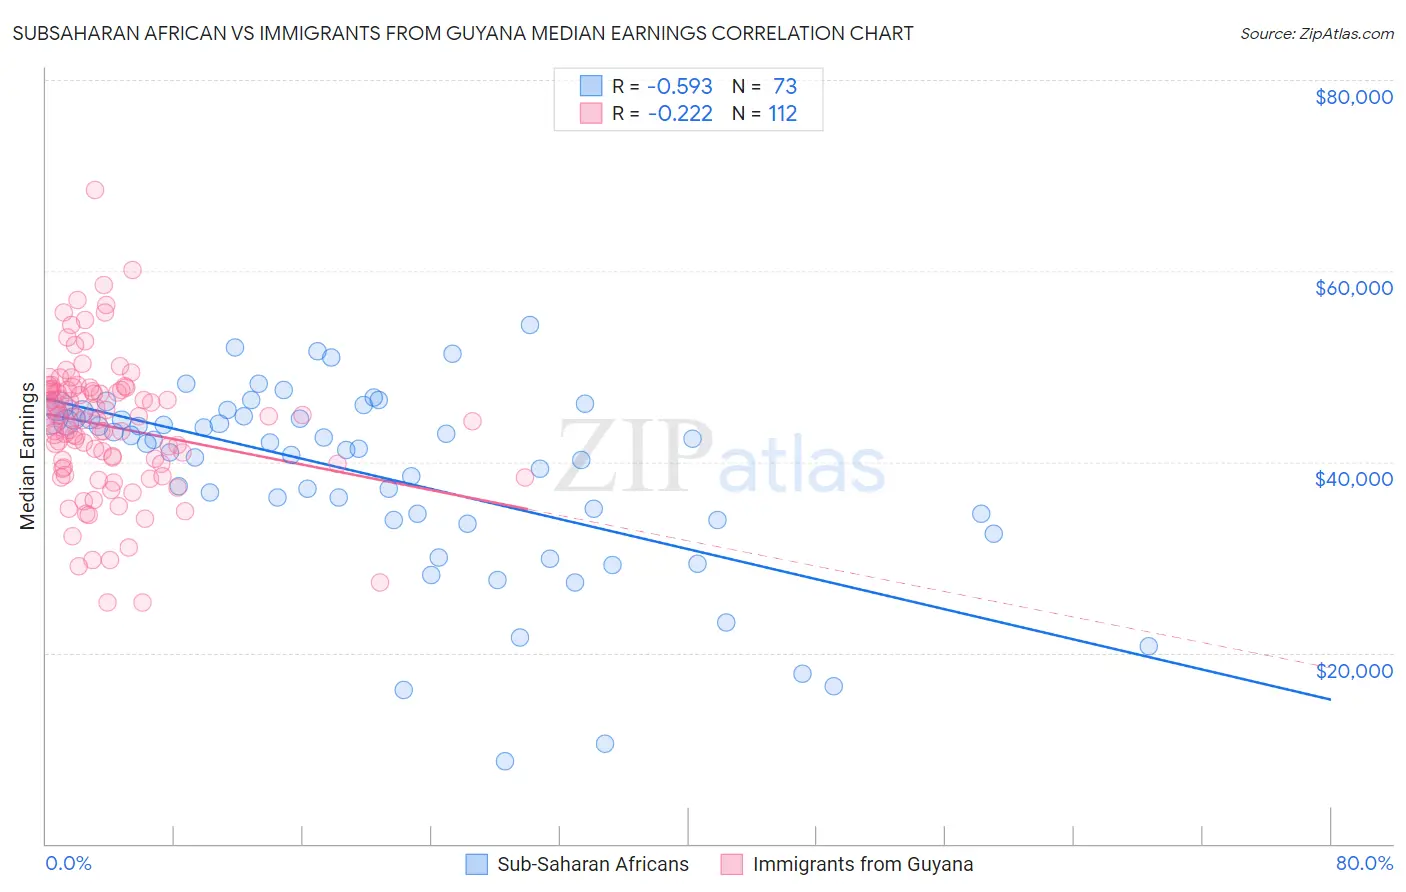
Subsaharan African vs Immigrants from Guyana Median Earnings Correlation Chart
The statistical analysis conducted on geographies consisting of 508,173,504 people shows a substantial negative correlation between the proportion of Sub-Saharan Africans and median earnings in the United States with a correlation coefficient (R) of -0.593 and weighted average of $44,118. Similarly, the statistical analysis conducted on geographies consisting of 183,726,948 people shows a weak negative correlation between the proportion of Immigrants from Guyana and median earnings in the United States with a correlation coefficient (R) of -0.222 and weighted average of $45,204, a difference of 2.5%.
Median Earnings Correlation Summary
| Measurement | Subsaharan African | Immigrants from Guyana |
| Minimum | $8,672 | $25,266 |
| Maximum | $54,367 | $68,439 |
| Range | $45,695 | $43,174 |
| Mean | $38,469 | $43,730 |
| Median | $41,866 | $44,540 |
| Interquartile 25% (IQ1) | $33,941 | $39,599 |
| Interquartile 75% (IQ3) | $44,774 | $47,563 |
| Interquartile Range (IQR) | $10,833 | $7,964 |
| Standard Deviation (Sample) | $9,878 | $7,179 |
| Standard Deviation (Population) | $9,810 | $7,147 |
Similar Demographics by Median Earnings
Demographics Similar to Sub-Saharan Africans by Median Earnings
In terms of median earnings, the demographic groups most similar to Sub-Saharan Africans are Nonimmigrants ($44,117, a difference of 0.0%), Immigrants from Venezuela ($44,163, a difference of 0.10%), Samoan ($44,206, a difference of 0.20%), Immigrants from Burma/Myanmar ($43,998, a difference of 0.27%), and Aleut ($44,241, a difference of 0.28%).
| Demographics | Rating | Rank | Median Earnings |
| British West Indians | 6.7 /100 | #236 | Tragic $44,552 |
| Immigrants | Ecuador | 5.9 /100 | #237 | Tragic $44,462 |
| Sudanese | 5.6 /100 | #238 | Tragic $44,419 |
| Senegalese | 5.3 /100 | #239 | Tragic $44,373 |
| Aleuts | 4.4 /100 | #240 | Tragic $44,241 |
| Samoans | 4.2 /100 | #241 | Tragic $44,206 |
| Immigrants | Venezuela | 4.0 /100 | #242 | Tragic $44,163 |
| Sub-Saharan Africans | 3.7 /100 | #243 | Tragic $44,118 |
| Immigrants | Nonimmigrants | 3.7 /100 | #244 | Tragic $44,117 |
| Immigrants | Burma/Myanmar | 3.2 /100 | #245 | Tragic $43,998 |
| Immigrants | West Indies | 3.1 /100 | #246 | Tragic $43,989 |
| Immigrants | Cabo Verde | 3.0 /100 | #247 | Tragic $43,963 |
| Nepalese | 2.6 /100 | #248 | Tragic $43,860 |
| Malaysians | 2.6 /100 | #249 | Tragic $43,844 |
| Alaska Natives | 2.3 /100 | #250 | Tragic $43,750 |
Demographics Similar to Immigrants from Guyana by Median Earnings
In terms of median earnings, the demographic groups most similar to Immigrants from Guyana are Immigrants from Panama ($45,198, a difference of 0.010%), Ecuadorian ($45,214, a difference of 0.020%), White/Caucasian ($45,197, a difference of 0.020%), West Indian ($45,132, a difference of 0.16%), and Immigrants from Cambodia ($45,090, a difference of 0.25%).
| Demographics | Rating | Rank | Median Earnings |
| Nigerians | 22.0 /100 | #214 | Fair $45,532 |
| Immigrants | Bangladesh | 22.0 /100 | #215 | Fair $45,532 |
| Guyanese | 20.6 /100 | #216 | Fair $45,470 |
| Tlingit-Haida | 20.5 /100 | #217 | Fair $45,468 |
| Spanish | 19.7 /100 | #218 | Poor $45,432 |
| Dutch | 18.4 /100 | #219 | Poor $45,370 |
| Ecuadorians | 15.3 /100 | #220 | Poor $45,214 |
| Immigrants | Guyana | 15.1 /100 | #221 | Poor $45,204 |
| Immigrants | Panama | 15.0 /100 | #222 | Poor $45,198 |
| Whites/Caucasians | 15.0 /100 | #223 | Poor $45,197 |
| West Indians | 13.9 /100 | #224 | Poor $45,132 |
| Immigrants | Cambodia | 13.2 /100 | #225 | Poor $45,090 |
| Immigrants | Nigeria | 12.2 /100 | #226 | Poor $45,030 |
| Native Hawaiians | 12.2 /100 | #227 | Poor $45,027 |
| Immigrants | Iraq | 11.6 /100 | #228 | Poor $44,988 |