Mexican vs Carpatho Rusyn Median Earnings
COMPARE
Mexican
Carpatho Rusyn
Median Earnings
Median Earnings Comparison
Mexicans
Carpatho Rusyns
$39,834
MEDIAN EARNINGS
0.0/ 100
METRIC RATING
321st/ 347
METRIC RANK
$48,617
MEDIAN EARNINGS
95.5/ 100
METRIC RATING
120th/ 347
METRIC RANK
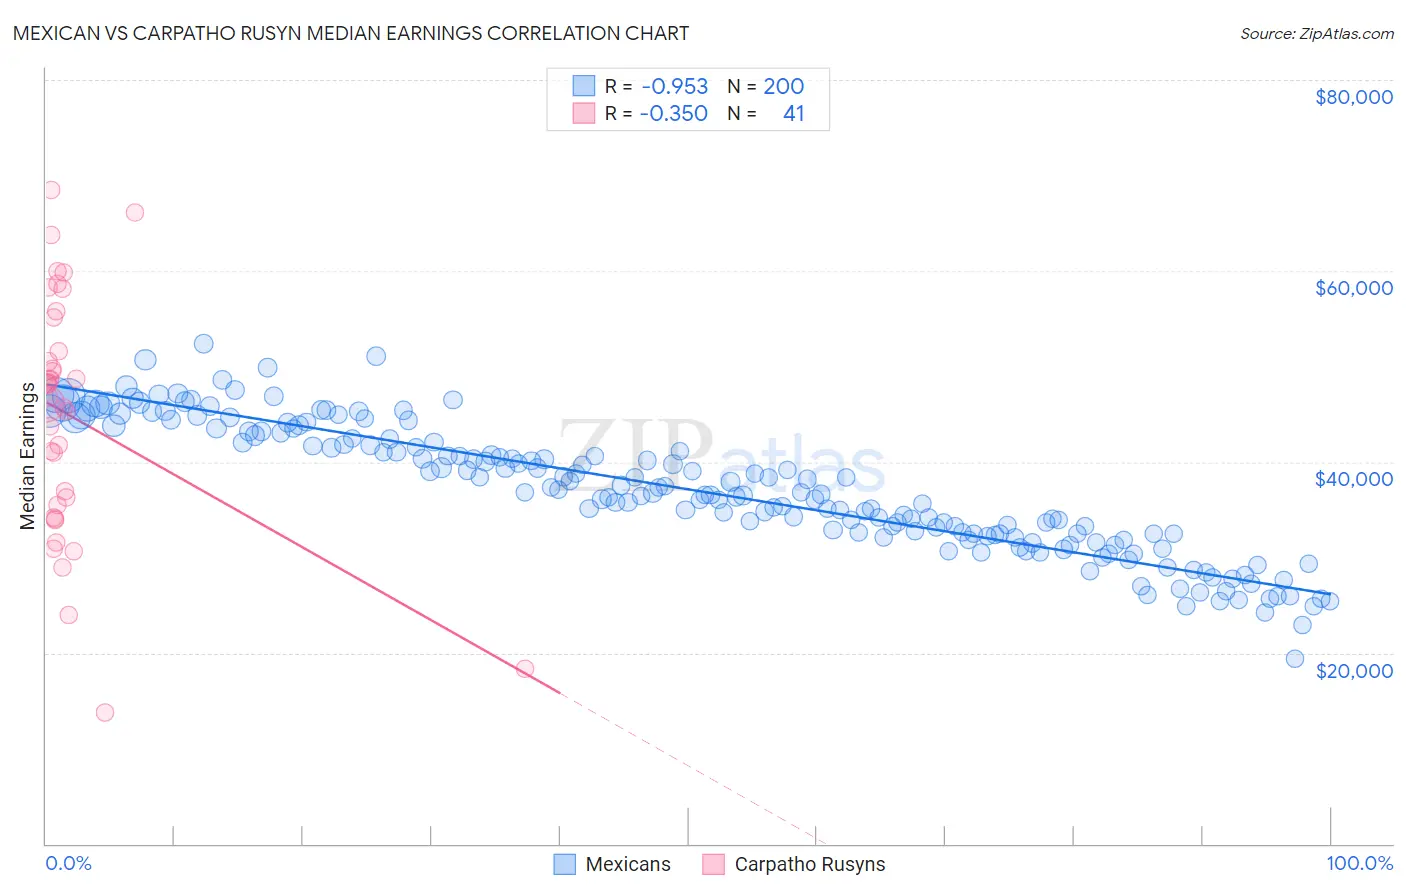
Mexican vs Carpatho Rusyn Median Earnings Correlation Chart
The statistical analysis conducted on geographies consisting of 564,951,151 people shows a perfect negative correlation between the proportion of Mexicans and median earnings in the United States with a correlation coefficient (R) of -0.953 and weighted average of $39,834. Similarly, the statistical analysis conducted on geographies consisting of 58,866,831 people shows a mild negative correlation between the proportion of Carpatho Rusyns and median earnings in the United States with a correlation coefficient (R) of -0.350 and weighted average of $48,617, a difference of 22.1%.
Median Earnings Correlation Summary
| Measurement | Mexican | Carpatho Rusyn |
| Minimum | $19,356 | $13,750 |
| Maximum | $52,379 | $68,541 |
| Range | $33,023 | $54,791 |
| Mean | $37,116 | $44,793 |
| Median | $36,764 | $46,820 |
| Interquartile 25% (IQ1) | $32,451 | $34,839 |
| Interquartile 75% (IQ3) | $42,421 | $53,317 |
| Interquartile Range (IQR) | $9,971 | $18,479 |
| Standard Deviation (Sample) | $6,683 | $12,606 |
| Standard Deviation (Population) | $6,666 | $12,452 |
Similar Demographics by Median Earnings
Demographics Similar to Mexicans by Median Earnings
In terms of median earnings, the demographic groups most similar to Mexicans are Immigrants from Bahamas ($39,861, a difference of 0.070%), Immigrants from Central America ($39,762, a difference of 0.18%), Bahamian ($39,735, a difference of 0.25%), Ottawa ($39,721, a difference of 0.29%), and Creek ($39,648, a difference of 0.47%).
| Demographics | Rating | Rank | Median Earnings |
| Cheyenne | 0.0 /100 | #314 | Tragic $40,233 |
| Seminole | 0.0 /100 | #315 | Tragic $40,233 |
| Immigrants | Honduras | 0.0 /100 | #316 | Tragic $40,195 |
| Fijians | 0.0 /100 | #317 | Tragic $40,193 |
| Dutch West Indians | 0.0 /100 | #318 | Tragic $40,107 |
| Blacks/African Americans | 0.0 /100 | #319 | Tragic $40,085 |
| Immigrants | Bahamas | 0.0 /100 | #320 | Tragic $39,861 |
| Mexicans | 0.0 /100 | #321 | Tragic $39,834 |
| Immigrants | Central America | 0.0 /100 | #322 | Tragic $39,762 |
| Bahamians | 0.0 /100 | #323 | Tragic $39,735 |
| Ottawa | 0.0 /100 | #324 | Tragic $39,721 |
| Creek | 0.0 /100 | #325 | Tragic $39,648 |
| Immigrants | Yemen | 0.0 /100 | #326 | Tragic $39,540 |
| Yuman | 0.0 /100 | #327 | Tragic $39,523 |
| Sioux | 0.0 /100 | #328 | Tragic $39,448 |
Demographics Similar to Carpatho Rusyns by Median Earnings
In terms of median earnings, the demographic groups most similar to Carpatho Rusyns are Arab ($48,599, a difference of 0.040%), Polish ($48,659, a difference of 0.080%), Immigrants from Jordan ($48,673, a difference of 0.11%), Serbian ($48,677, a difference of 0.12%), and Korean ($48,727, a difference of 0.23%).
| Demographics | Rating | Rank | Median Earnings |
| Immigrants | Kuwait | 96.8 /100 | #113 | Exceptional $48,861 |
| Moroccans | 96.7 /100 | #114 | Exceptional $48,838 |
| Chinese | 96.7 /100 | #115 | Exceptional $48,836 |
| Koreans | 96.2 /100 | #116 | Exceptional $48,727 |
| Serbians | 95.9 /100 | #117 | Exceptional $48,677 |
| Immigrants | Jordan | 95.9 /100 | #118 | Exceptional $48,673 |
| Poles | 95.8 /100 | #119 | Exceptional $48,659 |
| Carpatho Rusyns | 95.5 /100 | #120 | Exceptional $48,617 |
| Arabs | 95.4 /100 | #121 | Exceptional $48,599 |
| Chileans | 94.8 /100 | #122 | Exceptional $48,504 |
| Immigrants | Syria | 93.9 /100 | #123 | Exceptional $48,375 |
| Brazilians | 93.7 /100 | #124 | Exceptional $48,356 |
| Immigrants | Fiji | 93.3 /100 | #125 | Exceptional $48,305 |
| Assyrians/Chaldeans/Syriacs | 93.3 /100 | #126 | Exceptional $48,304 |
| Sierra Leoneans | 93.1 /100 | #127 | Exceptional $48,286 |