Mexican vs Immigrants from Uganda Median Earnings
COMPARE
Mexican
Immigrants from Uganda
Median Earnings
Median Earnings Comparison
Mexicans
Immigrants from Uganda
$39,834
MEDIAN EARNINGS
0.0/ 100
METRIC RATING
321st/ 347
METRIC RANK
$48,041
MEDIAN EARNINGS
90.5/ 100
METRIC RATING
133rd/ 347
METRIC RANK
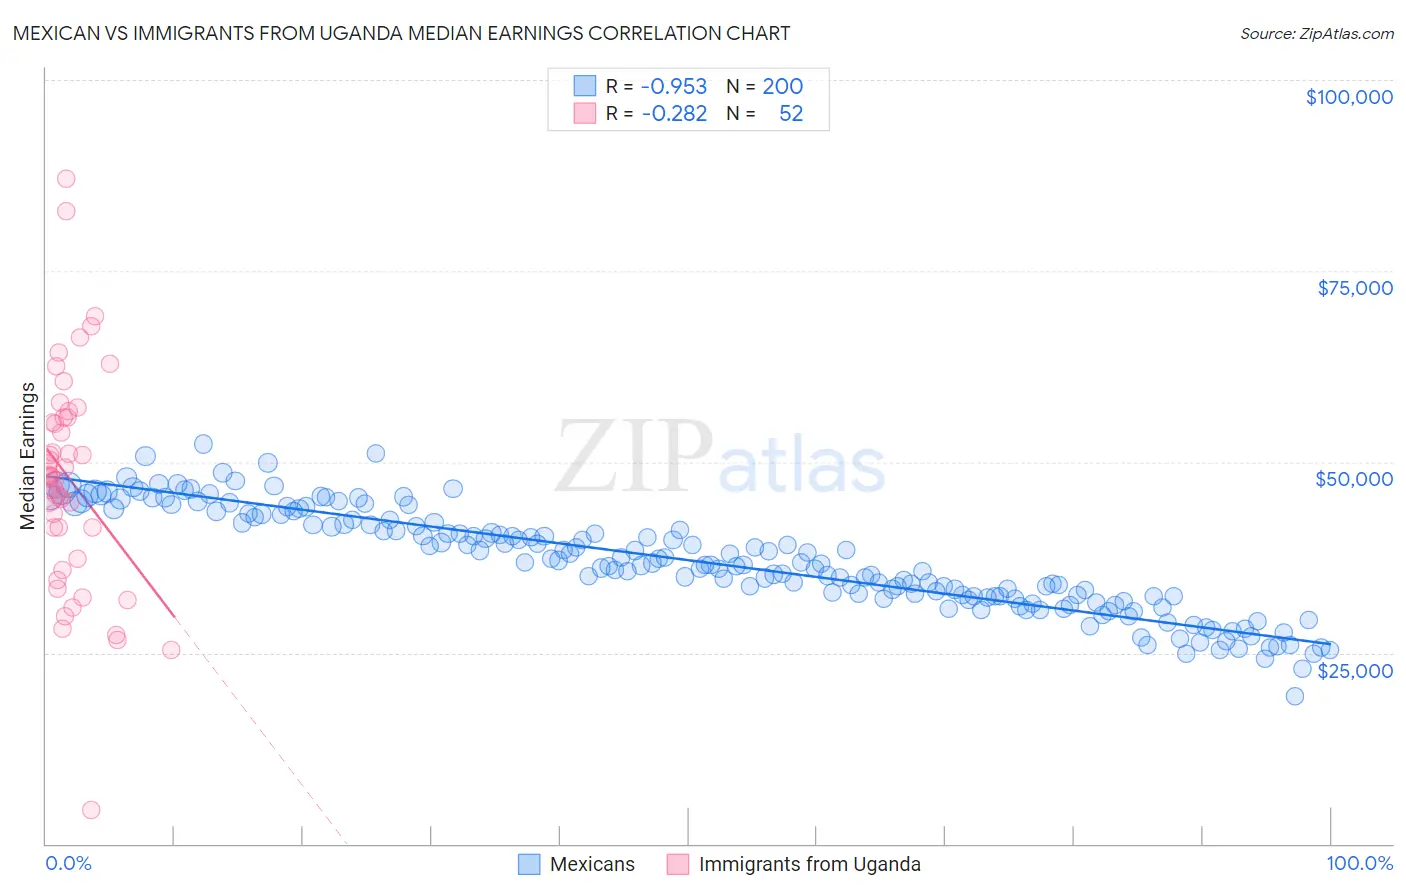
Mexican vs Immigrants from Uganda Median Earnings Correlation Chart
The statistical analysis conducted on geographies consisting of 564,951,151 people shows a perfect negative correlation between the proportion of Mexicans and median earnings in the United States with a correlation coefficient (R) of -0.953 and weighted average of $39,834. Similarly, the statistical analysis conducted on geographies consisting of 125,980,560 people shows a weak negative correlation between the proportion of Immigrants from Uganda and median earnings in the United States with a correlation coefficient (R) of -0.282 and weighted average of $48,041, a difference of 20.6%.
Median Earnings Correlation Summary
| Measurement | Mexican | Immigrants from Uganda |
| Minimum | $19,356 | $4,426 |
| Maximum | $52,379 | $87,021 |
| Range | $33,023 | $82,595 |
| Mean | $37,116 | $47,722 |
| Median | $36,764 | $48,140 |
| Interquartile 25% (IQ1) | $32,451 | $39,326 |
| Interquartile 75% (IQ3) | $42,421 | $55,755 |
| Interquartile Range (IQR) | $9,971 | $16,429 |
| Standard Deviation (Sample) | $6,683 | $14,671 |
| Standard Deviation (Population) | $6,666 | $14,529 |
Similar Demographics by Median Earnings
Demographics Similar to Mexicans by Median Earnings
In terms of median earnings, the demographic groups most similar to Mexicans are Immigrants from Bahamas ($39,861, a difference of 0.070%), Immigrants from Central America ($39,762, a difference of 0.18%), Bahamian ($39,735, a difference of 0.25%), Ottawa ($39,721, a difference of 0.29%), and Creek ($39,648, a difference of 0.47%).
| Demographics | Rating | Rank | Median Earnings |
| Cheyenne | 0.0 /100 | #314 | Tragic $40,233 |
| Seminole | 0.0 /100 | #315 | Tragic $40,233 |
| Immigrants | Honduras | 0.0 /100 | #316 | Tragic $40,195 |
| Fijians | 0.0 /100 | #317 | Tragic $40,193 |
| Dutch West Indians | 0.0 /100 | #318 | Tragic $40,107 |
| Blacks/African Americans | 0.0 /100 | #319 | Tragic $40,085 |
| Immigrants | Bahamas | 0.0 /100 | #320 | Tragic $39,861 |
| Mexicans | 0.0 /100 | #321 | Tragic $39,834 |
| Immigrants | Central America | 0.0 /100 | #322 | Tragic $39,762 |
| Bahamians | 0.0 /100 | #323 | Tragic $39,735 |
| Ottawa | 0.0 /100 | #324 | Tragic $39,721 |
| Creek | 0.0 /100 | #325 | Tragic $39,648 |
| Immigrants | Yemen | 0.0 /100 | #326 | Tragic $39,540 |
| Yuman | 0.0 /100 | #327 | Tragic $39,523 |
| Sioux | 0.0 /100 | #328 | Tragic $39,448 |
Demographics Similar to Immigrants from Uganda by Median Earnings
In terms of median earnings, the demographic groups most similar to Immigrants from Uganda are Sri Lankan ($48,040, a difference of 0.0%), Portuguese ($48,032, a difference of 0.020%), Slovene ($47,995, a difference of 0.10%), Immigrants from Nepal ($47,925, a difference of 0.24%), and European ($47,915, a difference of 0.26%).
| Demographics | Rating | Rank | Median Earnings |
| Assyrians/Chaldeans/Syriacs | 93.3 /100 | #126 | Exceptional $48,304 |
| Sierra Leoneans | 93.1 /100 | #127 | Exceptional $48,286 |
| Immigrants | Philippines | 92.9 /100 | #128 | Exceptional $48,266 |
| Pakistanis | 92.8 /100 | #129 | Exceptional $48,254 |
| Zimbabweans | 92.6 /100 | #130 | Exceptional $48,229 |
| Lebanese | 92.5 /100 | #131 | Exceptional $48,226 |
| British | 92.2 /100 | #132 | Exceptional $48,189 |
| Immigrants | Uganda | 90.5 /100 | #133 | Exceptional $48,041 |
| Sri Lankans | 90.5 /100 | #134 | Exceptional $48,040 |
| Portuguese | 90.4 /100 | #135 | Exceptional $48,032 |
| Slovenes | 90.0 /100 | #136 | Excellent $47,995 |
| Immigrants | Nepal | 89.0 /100 | #137 | Excellent $47,925 |
| Europeans | 88.9 /100 | #138 | Excellent $47,915 |
| Canadians | 88.8 /100 | #139 | Excellent $47,911 |
| Taiwanese | 88.7 /100 | #140 | Excellent $47,902 |