Mexican vs Burmese Median Earnings
COMPARE
Mexican
Burmese
Median Earnings
Median Earnings Comparison
Mexicans
Burmese
$39,834
MEDIAN EARNINGS
0.0/ 100
METRIC RATING
321st/ 347
METRIC RANK
$54,559
MEDIAN EARNINGS
100.0/ 100
METRIC RATING
21st/ 347
METRIC RANK
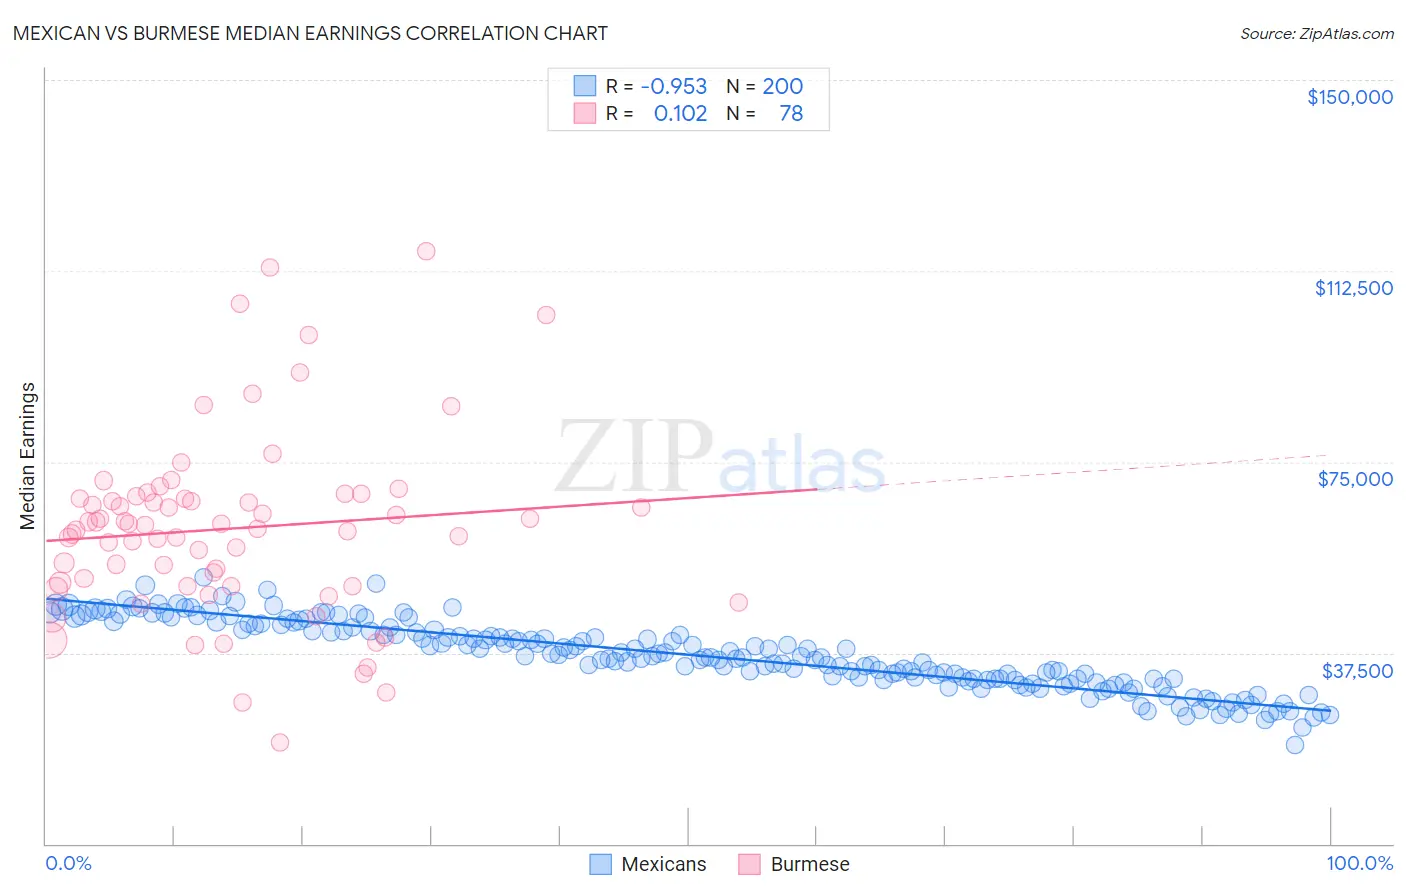
Mexican vs Burmese Median Earnings Correlation Chart
The statistical analysis conducted on geographies consisting of 564,951,151 people shows a perfect negative correlation between the proportion of Mexicans and median earnings in the United States with a correlation coefficient (R) of -0.953 and weighted average of $39,834. Similarly, the statistical analysis conducted on geographies consisting of 465,399,641 people shows a poor positive correlation between the proportion of Burmese and median earnings in the United States with a correlation coefficient (R) of 0.102 and weighted average of $54,559, a difference of 37.0%.
Median Earnings Correlation Summary
| Measurement | Mexican | Burmese |
| Minimum | $19,356 | $20,000 |
| Maximum | $52,379 | $116,380 |
| Range | $33,023 | $96,380 |
| Mean | $37,116 | $61,901 |
| Median | $36,764 | $62,283 |
| Interquartile 25% (IQ1) | $32,451 | $50,678 |
| Interquartile 75% (IQ3) | $42,421 | $67,756 |
| Interquartile Range (IQR) | $9,971 | $17,078 |
| Standard Deviation (Sample) | $6,683 | $18,078 |
| Standard Deviation (Population) | $6,666 | $17,962 |
Similar Demographics by Median Earnings
Demographics Similar to Mexicans by Median Earnings
In terms of median earnings, the demographic groups most similar to Mexicans are Immigrants from Bahamas ($39,861, a difference of 0.070%), Immigrants from Central America ($39,762, a difference of 0.18%), Bahamian ($39,735, a difference of 0.25%), Ottawa ($39,721, a difference of 0.29%), and Creek ($39,648, a difference of 0.47%).
| Demographics | Rating | Rank | Median Earnings |
| Cheyenne | 0.0 /100 | #314 | Tragic $40,233 |
| Seminole | 0.0 /100 | #315 | Tragic $40,233 |
| Immigrants | Honduras | 0.0 /100 | #316 | Tragic $40,195 |
| Fijians | 0.0 /100 | #317 | Tragic $40,193 |
| Dutch West Indians | 0.0 /100 | #318 | Tragic $40,107 |
| Blacks/African Americans | 0.0 /100 | #319 | Tragic $40,085 |
| Immigrants | Bahamas | 0.0 /100 | #320 | Tragic $39,861 |
| Mexicans | 0.0 /100 | #321 | Tragic $39,834 |
| Immigrants | Central America | 0.0 /100 | #322 | Tragic $39,762 |
| Bahamians | 0.0 /100 | #323 | Tragic $39,735 |
| Ottawa | 0.0 /100 | #324 | Tragic $39,721 |
| Creek | 0.0 /100 | #325 | Tragic $39,648 |
| Immigrants | Yemen | 0.0 /100 | #326 | Tragic $39,540 |
| Yuman | 0.0 /100 | #327 | Tragic $39,523 |
| Sioux | 0.0 /100 | #328 | Tragic $39,448 |
Demographics Similar to Burmese by Median Earnings
In terms of median earnings, the demographic groups most similar to Burmese are Immigrants from Korea ($54,530, a difference of 0.050%), Cypriot ($54,589, a difference of 0.060%), Immigrants from Sweden ($54,478, a difference of 0.15%), Immigrants from Belgium ($54,679, a difference of 0.22%), and Soviet Union ($54,290, a difference of 0.50%).
| Demographics | Rating | Rank | Median Earnings |
| Immigrants | Australia | 100.0 /100 | #14 | Exceptional $56,305 |
| Indians (Asian) | 100.0 /100 | #15 | Exceptional $56,253 |
| Immigrants | Eastern Asia | 100.0 /100 | #16 | Exceptional $56,183 |
| Eastern Europeans | 100.0 /100 | #17 | Exceptional $55,084 |
| Immigrants | Japan | 100.0 /100 | #18 | Exceptional $54,938 |
| Immigrants | Belgium | 100.0 /100 | #19 | Exceptional $54,679 |
| Cypriots | 100.0 /100 | #20 | Exceptional $54,589 |
| Burmese | 100.0 /100 | #21 | Exceptional $54,559 |
| Immigrants | Korea | 100.0 /100 | #22 | Exceptional $54,530 |
| Immigrants | Sweden | 100.0 /100 | #23 | Exceptional $54,478 |
| Soviet Union | 100.0 /100 | #24 | Exceptional $54,290 |
| Turks | 100.0 /100 | #25 | Exceptional $53,919 |
| Immigrants | Northern Europe | 100.0 /100 | #26 | Exceptional $53,872 |
| Asians | 100.0 /100 | #27 | Exceptional $53,690 |
| Immigrants | France | 100.0 /100 | #28 | Exceptional $53,490 |