Mexican vs Immigrants from Egypt Median Earnings
COMPARE
Mexican
Immigrants from Egypt
Median Earnings
Median Earnings Comparison
Mexicans
Immigrants from Egypt
$39,834
MEDIAN EARNINGS
0.0/ 100
METRIC RATING
321st/ 347
METRIC RANK
$50,901
MEDIAN EARNINGS
99.8/ 100
METRIC RATING
72nd/ 347
METRIC RANK
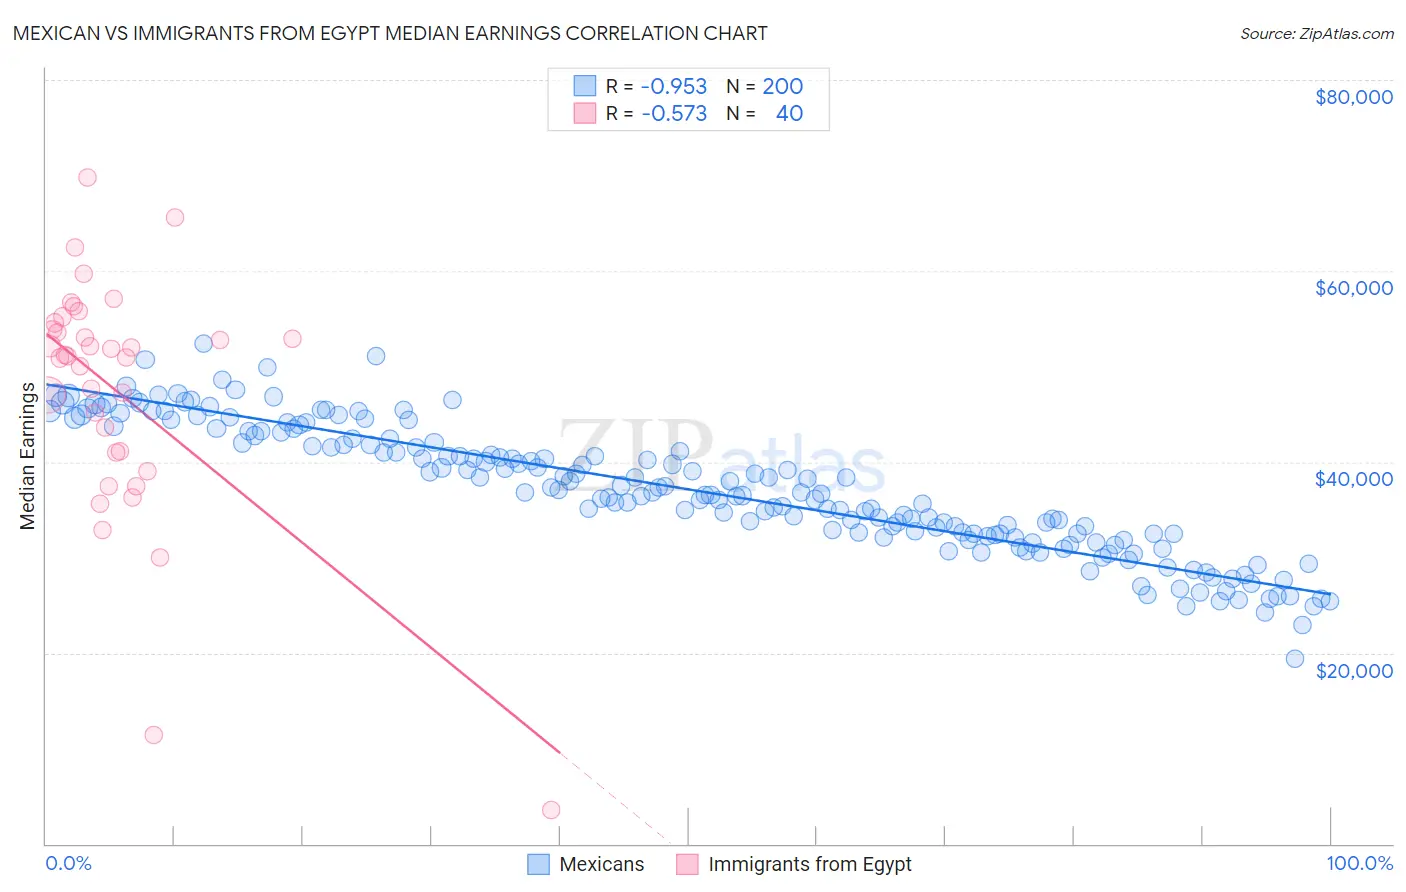
Mexican vs Immigrants from Egypt Median Earnings Correlation Chart
The statistical analysis conducted on geographies consisting of 564,951,151 people shows a perfect negative correlation between the proportion of Mexicans and median earnings in the United States with a correlation coefficient (R) of -0.953 and weighted average of $39,834. Similarly, the statistical analysis conducted on geographies consisting of 245,492,399 people shows a substantial negative correlation between the proportion of Immigrants from Egypt and median earnings in the United States with a correlation coefficient (R) of -0.573 and weighted average of $50,901, a difference of 27.8%.
Median Earnings Correlation Summary
| Measurement | Mexican | Immigrants from Egypt |
| Minimum | $19,356 | $3,500 |
| Maximum | $52,379 | $69,809 |
| Range | $33,023 | $66,309 |
| Mean | $37,116 | $47,452 |
| Median | $36,764 | $51,173 |
| Interquartile 25% (IQ1) | $32,451 | $41,070 |
| Interquartile 75% (IQ3) | $42,421 | $54,227 |
| Interquartile Range (IQR) | $9,971 | $13,157 |
| Standard Deviation (Sample) | $6,683 | $12,746 |
| Standard Deviation (Population) | $6,666 | $12,585 |
Similar Demographics by Median Earnings
Demographics Similar to Mexicans by Median Earnings
In terms of median earnings, the demographic groups most similar to Mexicans are Immigrants from Bahamas ($39,861, a difference of 0.070%), Immigrants from Central America ($39,762, a difference of 0.18%), Bahamian ($39,735, a difference of 0.25%), Ottawa ($39,721, a difference of 0.29%), and Creek ($39,648, a difference of 0.47%).
| Demographics | Rating | Rank | Median Earnings |
| Cheyenne | 0.0 /100 | #314 | Tragic $40,233 |
| Seminole | 0.0 /100 | #315 | Tragic $40,233 |
| Immigrants | Honduras | 0.0 /100 | #316 | Tragic $40,195 |
| Fijians | 0.0 /100 | #317 | Tragic $40,193 |
| Dutch West Indians | 0.0 /100 | #318 | Tragic $40,107 |
| Blacks/African Americans | 0.0 /100 | #319 | Tragic $40,085 |
| Immigrants | Bahamas | 0.0 /100 | #320 | Tragic $39,861 |
| Mexicans | 0.0 /100 | #321 | Tragic $39,834 |
| Immigrants | Central America | 0.0 /100 | #322 | Tragic $39,762 |
| Bahamians | 0.0 /100 | #323 | Tragic $39,735 |
| Ottawa | 0.0 /100 | #324 | Tragic $39,721 |
| Creek | 0.0 /100 | #325 | Tragic $39,648 |
| Immigrants | Yemen | 0.0 /100 | #326 | Tragic $39,540 |
| Yuman | 0.0 /100 | #327 | Tragic $39,523 |
| Sioux | 0.0 /100 | #328 | Tragic $39,448 |
Demographics Similar to Immigrants from Egypt by Median Earnings
In terms of median earnings, the demographic groups most similar to Immigrants from Egypt are Immigrants from Ukraine ($50,984, a difference of 0.16%), Immigrants from Netherlands ($50,818, a difference of 0.16%), Lithuanian ($50,991, a difference of 0.18%), Mongolian ($51,038, a difference of 0.27%), and South African ($50,752, a difference of 0.29%).
| Demographics | Rating | Rank | Median Earnings |
| Greeks | 99.9 /100 | #65 | Exceptional $51,164 |
| Afghans | 99.9 /100 | #66 | Exceptional $51,112 |
| Immigrants | Spain | 99.9 /100 | #67 | Exceptional $51,092 |
| Paraguayans | 99.9 /100 | #68 | Exceptional $51,068 |
| Mongolians | 99.8 /100 | #69 | Exceptional $51,038 |
| Lithuanians | 99.8 /100 | #70 | Exceptional $50,991 |
| Immigrants | Ukraine | 99.8 /100 | #71 | Exceptional $50,984 |
| Immigrants | Egypt | 99.8 /100 | #72 | Exceptional $50,901 |
| Immigrants | Netherlands | 99.8 /100 | #73 | Exceptional $50,818 |
| South Africans | 99.8 /100 | #74 | Exceptional $50,752 |
| Immigrants | Scotland | 99.8 /100 | #75 | Exceptional $50,741 |
| Immigrants | Italy | 99.7 /100 | #76 | Exceptional $50,581 |
| Immigrants | Western Europe | 99.7 /100 | #77 | Exceptional $50,549 |
| Argentineans | 99.6 /100 | #78 | Exceptional $50,399 |
| Laotians | 99.6 /100 | #79 | Exceptional $50,343 |