Mexican vs Spanish American Median Earnings
COMPARE
Mexican
Spanish American
Median Earnings
Median Earnings Comparison
Mexicans
Spanish Americans
$39,834
MEDIAN EARNINGS
0.0/ 100
METRIC RATING
321st/ 347
METRIC RANK
$42,316
MEDIAN EARNINGS
0.3/ 100
METRIC RATING
276th/ 347
METRIC RANK
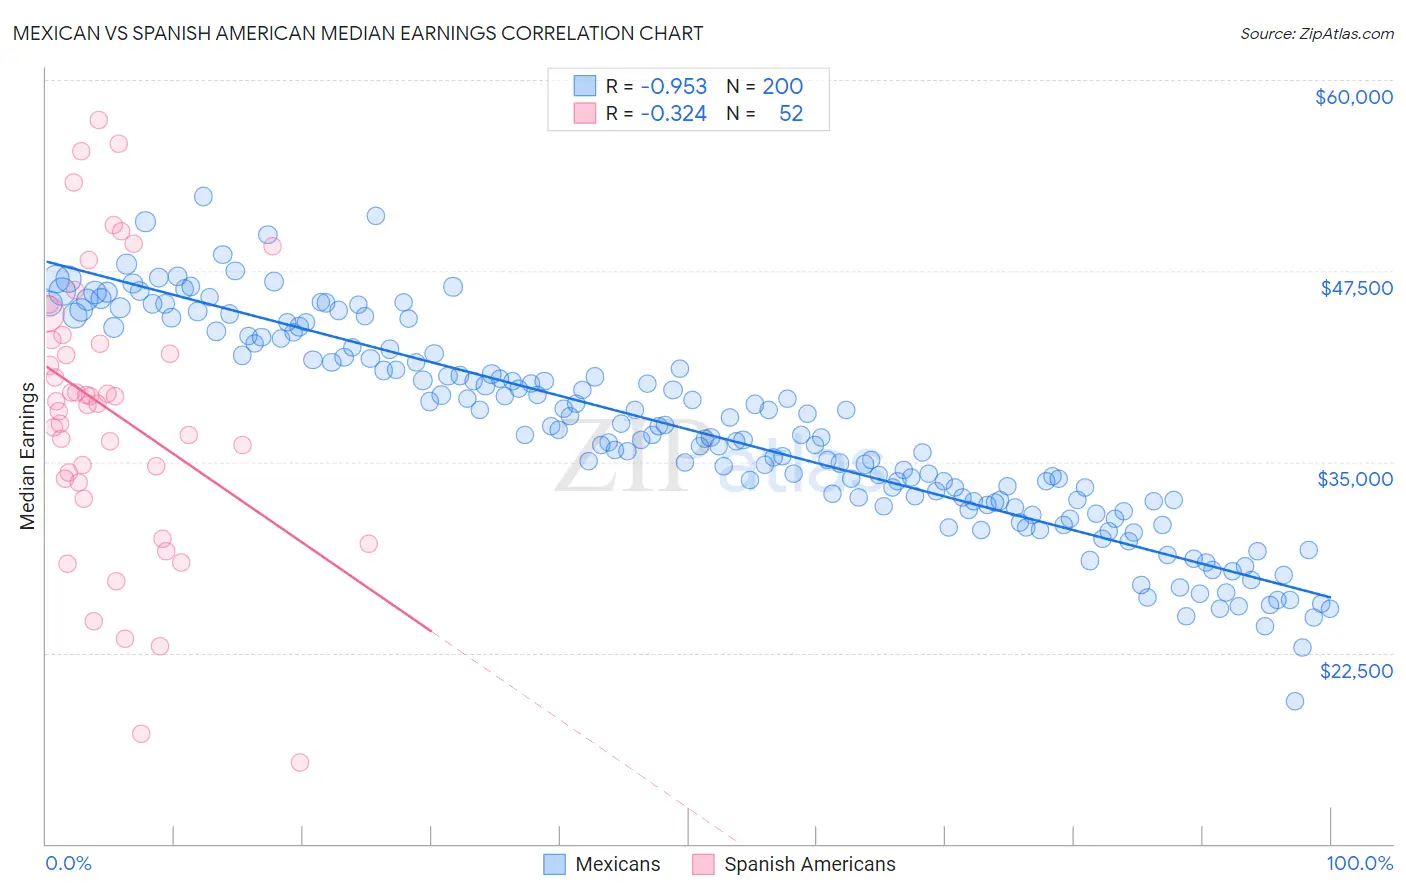
Mexican vs Spanish American Median Earnings Correlation Chart
The statistical analysis conducted on geographies consisting of 564,951,151 people shows a perfect negative correlation between the proportion of Mexicans and median earnings in the United States with a correlation coefficient (R) of -0.953 and weighted average of $39,834. Similarly, the statistical analysis conducted on geographies consisting of 103,163,926 people shows a mild negative correlation between the proportion of Spanish Americans and median earnings in the United States with a correlation coefficient (R) of -0.324 and weighted average of $42,316, a difference of 6.2%.
Median Earnings Correlation Summary
| Measurement | Mexican | Spanish American |
| Minimum | $19,356 | $15,345 |
| Maximum | $52,379 | $57,404 |
| Range | $33,023 | $42,059 |
| Mean | $37,116 | $38,311 |
| Median | $36,764 | $38,863 |
| Interquartile 25% (IQ1) | $32,451 | $33,792 |
| Interquartile 75% (IQ3) | $42,421 | $43,155 |
| Interquartile Range (IQR) | $9,971 | $9,363 |
| Standard Deviation (Sample) | $6,683 | $9,272 |
| Standard Deviation (Population) | $6,666 | $9,182 |
Similar Demographics by Median Earnings
Demographics Similar to Mexicans by Median Earnings
In terms of median earnings, the demographic groups most similar to Mexicans are Immigrants from Bahamas ($39,861, a difference of 0.070%), Immigrants from Central America ($39,762, a difference of 0.18%), Bahamian ($39,735, a difference of 0.25%), Ottawa ($39,721, a difference of 0.29%), and Creek ($39,648, a difference of 0.47%).
| Demographics | Rating | Rank | Median Earnings |
| Cheyenne | 0.0 /100 | #314 | Tragic $40,233 |
| Seminole | 0.0 /100 | #315 | Tragic $40,233 |
| Immigrants | Honduras | 0.0 /100 | #316 | Tragic $40,195 |
| Fijians | 0.0 /100 | #317 | Tragic $40,193 |
| Dutch West Indians | 0.0 /100 | #318 | Tragic $40,107 |
| Blacks/African Americans | 0.0 /100 | #319 | Tragic $40,085 |
| Immigrants | Bahamas | 0.0 /100 | #320 | Tragic $39,861 |
| Mexicans | 0.0 /100 | #321 | Tragic $39,834 |
| Immigrants | Central America | 0.0 /100 | #322 | Tragic $39,762 |
| Bahamians | 0.0 /100 | #323 | Tragic $39,735 |
| Ottawa | 0.0 /100 | #324 | Tragic $39,721 |
| Creek | 0.0 /100 | #325 | Tragic $39,648 |
| Immigrants | Yemen | 0.0 /100 | #326 | Tragic $39,540 |
| Yuman | 0.0 /100 | #327 | Tragic $39,523 |
| Sioux | 0.0 /100 | #328 | Tragic $39,448 |
Demographics Similar to Spanish Americans by Median Earnings
In terms of median earnings, the demographic groups most similar to Spanish Americans are Immigrants from Belize ($42,339, a difference of 0.060%), Central American ($42,280, a difference of 0.090%), Immigrants from El Salvador ($42,413, a difference of 0.23%), Immigrants from Dominica ($42,420, a difference of 0.25%), and Iroquois ($42,430, a difference of 0.27%).
| Demographics | Rating | Rank | Median Earnings |
| Belizeans | 0.5 /100 | #269 | Tragic $42,702 |
| Osage | 0.5 /100 | #270 | Tragic $42,651 |
| Pennsylvania Germans | 0.5 /100 | #271 | Tragic $42,615 |
| Iroquois | 0.4 /100 | #272 | Tragic $42,430 |
| Immigrants | Dominica | 0.4 /100 | #273 | Tragic $42,420 |
| Immigrants | El Salvador | 0.4 /100 | #274 | Tragic $42,413 |
| Immigrants | Belize | 0.3 /100 | #275 | Tragic $42,339 |
| Spanish Americans | 0.3 /100 | #276 | Tragic $42,316 |
| Central Americans | 0.3 /100 | #277 | Tragic $42,280 |
| Cajuns | 0.3 /100 | #278 | Tragic $42,189 |
| Colville | 0.2 /100 | #279 | Tragic $42,151 |
| Hmong | 0.2 /100 | #280 | Tragic $42,111 |
| Marshallese | 0.2 /100 | #281 | Tragic $41,969 |
| Africans | 0.2 /100 | #282 | Tragic $41,955 |
| Dominicans | 0.2 /100 | #283 | Tragic $41,864 |