Mexican vs Immigrants from Guyana 3 or more Vehicles in Household
COMPARE
Mexican
Immigrants from Guyana
3 or more Vehicles in Household
3 or more Vehicles in Household Comparison
Mexicans
Immigrants from Guyana
24.7%
3 OR MORE VEHICLES IN HOUSEHOLD
100.0/ 100
METRIC RATING
13th/ 347
METRIC RANK
11.2%
3 OR MORE VEHICLES IN HOUSEHOLD
0.0/ 100
METRIC RATING
343rd/ 347
METRIC RANK
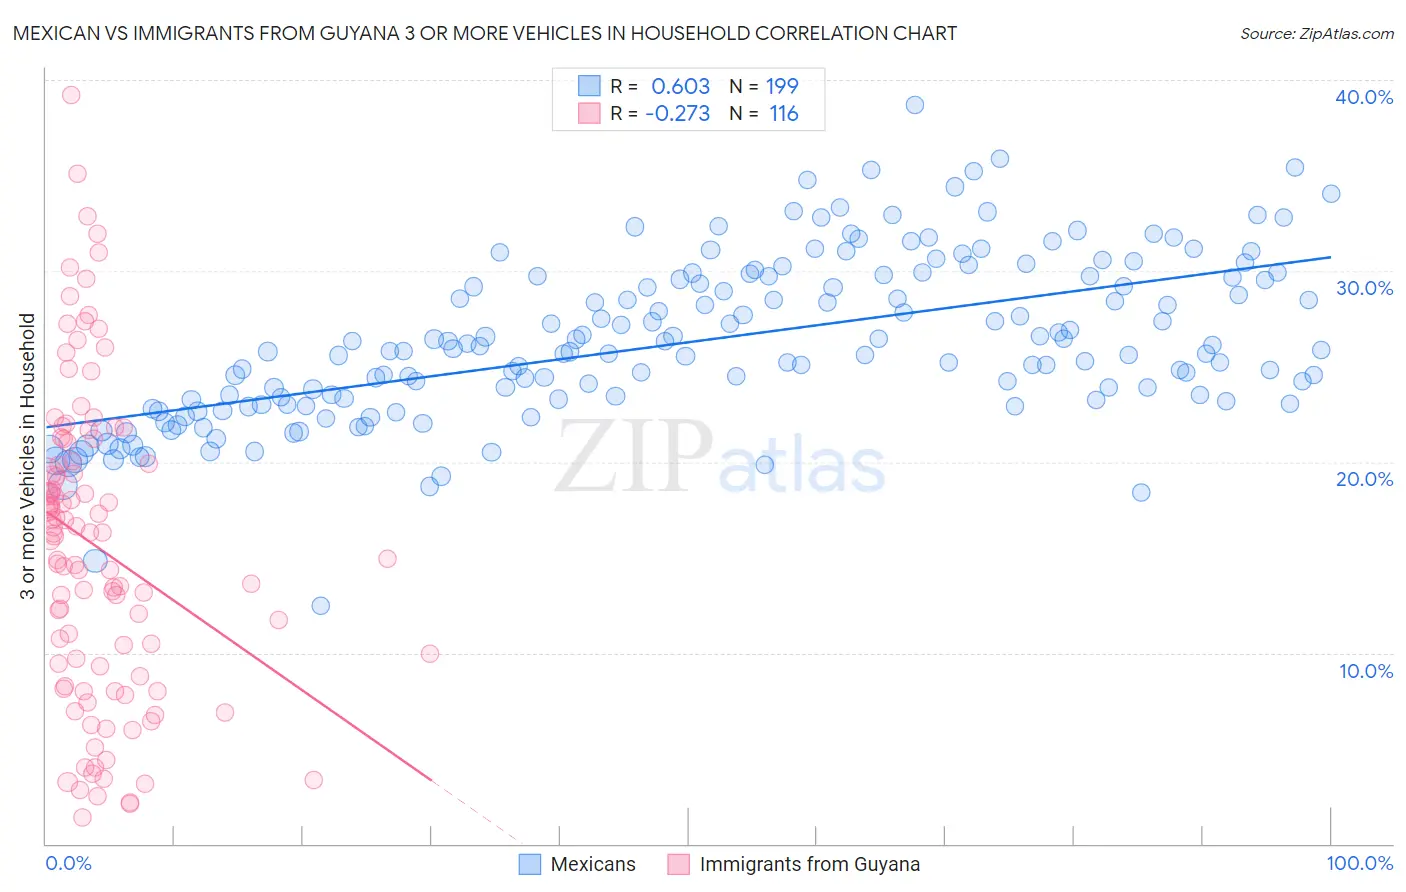
Mexican vs Immigrants from Guyana 3 or more Vehicles in Household Correlation Chart
The statistical analysis conducted on geographies consisting of 564,088,785 people shows a significant positive correlation between the proportion of Mexicans and percentage of households with 3 or more vehicles available in the United States with a correlation coefficient (R) of 0.603 and weighted average of 24.7%. Similarly, the statistical analysis conducted on geographies consisting of 183,650,953 people shows a weak negative correlation between the proportion of Immigrants from Guyana and percentage of households with 3 or more vehicles available in the United States with a correlation coefficient (R) of -0.273 and weighted average of 11.2%, a difference of 119.8%.
3 or more Vehicles in Household Correlation Summary
| Measurement | Mexican | Immigrants from Guyana |
| Minimum | 12.5% | 1.4% |
| Maximum | 38.7% | 39.2% |
| Range | 26.3% | 37.8% |
| Mean | 26.3% | 15.5% |
| Median | 25.8% | 16.2% |
| Interquartile 25% (IQ1) | 23.2% | 9.0% |
| Interquartile 75% (IQ3) | 29.6% | 20.5% |
| Interquartile Range (IQR) | 6.4% | 11.5% |
| Standard Deviation (Sample) | 4.3% | 8.1% |
| Standard Deviation (Population) | 4.3% | 8.1% |
Similar Demographics by 3 or more Vehicles in Household
Demographics Similar to Mexicans by 3 or more Vehicles in Household
In terms of 3 or more vehicles in household, the demographic groups most similar to Mexicans are Danish (24.7%, a difference of 0.080%), Immigrants from Mexico (24.6%, a difference of 0.44%), Shoshone (24.9%, a difference of 0.77%), Nepalese (24.9%, a difference of 0.87%), and Native Hawaiian (24.9%, a difference of 0.96%).
| Demographics | Rating | Rank | 3 or more Vehicles in Household |
| Immigrants | Fiji | 100.0 /100 | #6 | Exceptional 26.1% |
| Colville | 100.0 /100 | #7 | Exceptional 25.8% |
| Samoans | 100.0 /100 | #8 | Exceptional 25.0% |
| Native Hawaiians | 100.0 /100 | #9 | Exceptional 24.9% |
| Nepalese | 100.0 /100 | #10 | Exceptional 24.9% |
| Shoshone | 100.0 /100 | #11 | Exceptional 24.9% |
| Danes | 100.0 /100 | #12 | Exceptional 24.7% |
| Mexicans | 100.0 /100 | #13 | Exceptional 24.7% |
| Immigrants | Mexico | 100.0 /100 | #14 | Exceptional 24.6% |
| Hawaiians | 100.0 /100 | #15 | Exceptional 24.3% |
| Basques | 100.0 /100 | #16 | Exceptional 24.3% |
| Koreans | 100.0 /100 | #17 | Exceptional 24.1% |
| Norwegians | 100.0 /100 | #18 | Exceptional 23.9% |
| Chinese | 100.0 /100 | #19 | Exceptional 23.9% |
| Paiute | 100.0 /100 | #20 | Exceptional 23.8% |
Demographics Similar to Immigrants from Guyana by 3 or more Vehicles in Household
In terms of 3 or more vehicles in household, the demographic groups most similar to Immigrants from Guyana are Dominican (11.2%, a difference of 0.15%), British West Indian (11.4%, a difference of 1.8%), Guyanese (11.5%, a difference of 1.9%), Immigrants from Barbados (11.7%, a difference of 4.3%), and Immigrants from Uzbekistan (12.0%, a difference of 6.6%).
| Demographics | Rating | Rank | 3 or more Vehicles in Household |
| Immigrants | Cabo Verde | 0.0 /100 | #333 | Tragic 13.6% |
| Immigrants | Ecuador | 0.0 /100 | #334 | Tragic 13.4% |
| Immigrants | Trinidad and Tobago | 0.0 /100 | #335 | Tragic 13.3% |
| Barbadians | 0.0 /100 | #336 | Tragic 12.6% |
| Immigrants | Bangladesh | 0.0 /100 | #337 | Tragic 12.5% |
| Vietnamese | 0.0 /100 | #338 | Tragic 12.5% |
| Immigrants | Uzbekistan | 0.0 /100 | #339 | Tragic 12.0% |
| Immigrants | Barbados | 0.0 /100 | #340 | Tragic 11.7% |
| Guyanese | 0.0 /100 | #341 | Tragic 11.5% |
| British West Indians | 0.0 /100 | #342 | Tragic 11.4% |
| Immigrants | Guyana | 0.0 /100 | #343 | Tragic 11.2% |
| Dominicans | 0.0 /100 | #344 | Tragic 11.2% |
| Immigrants | Dominican Republic | 0.0 /100 | #345 | Tragic 10.4% |
| Immigrants | St. Vincent and the Grenadines | 0.0 /100 | #346 | Tragic 10.1% |
| Immigrants | Grenada | 0.0 /100 | #347 | Tragic 9.1% |