Mexican American Indian vs Immigrants from Trinidad and Tobago Median Household Income
COMPARE
Mexican American Indian
Immigrants from Trinidad and Tobago
Median Household Income
Median Household Income Comparison
Mexican American Indians
Immigrants from Trinidad and Tobago
$78,166
MEDIAN HOUSEHOLD INCOME
1.2/ 100
METRIC RATING
251st/ 347
METRIC RANK
$80,373
MEDIAN HOUSEHOLD INCOME
4.6/ 100
METRIC RATING
232nd/ 347
METRIC RANK
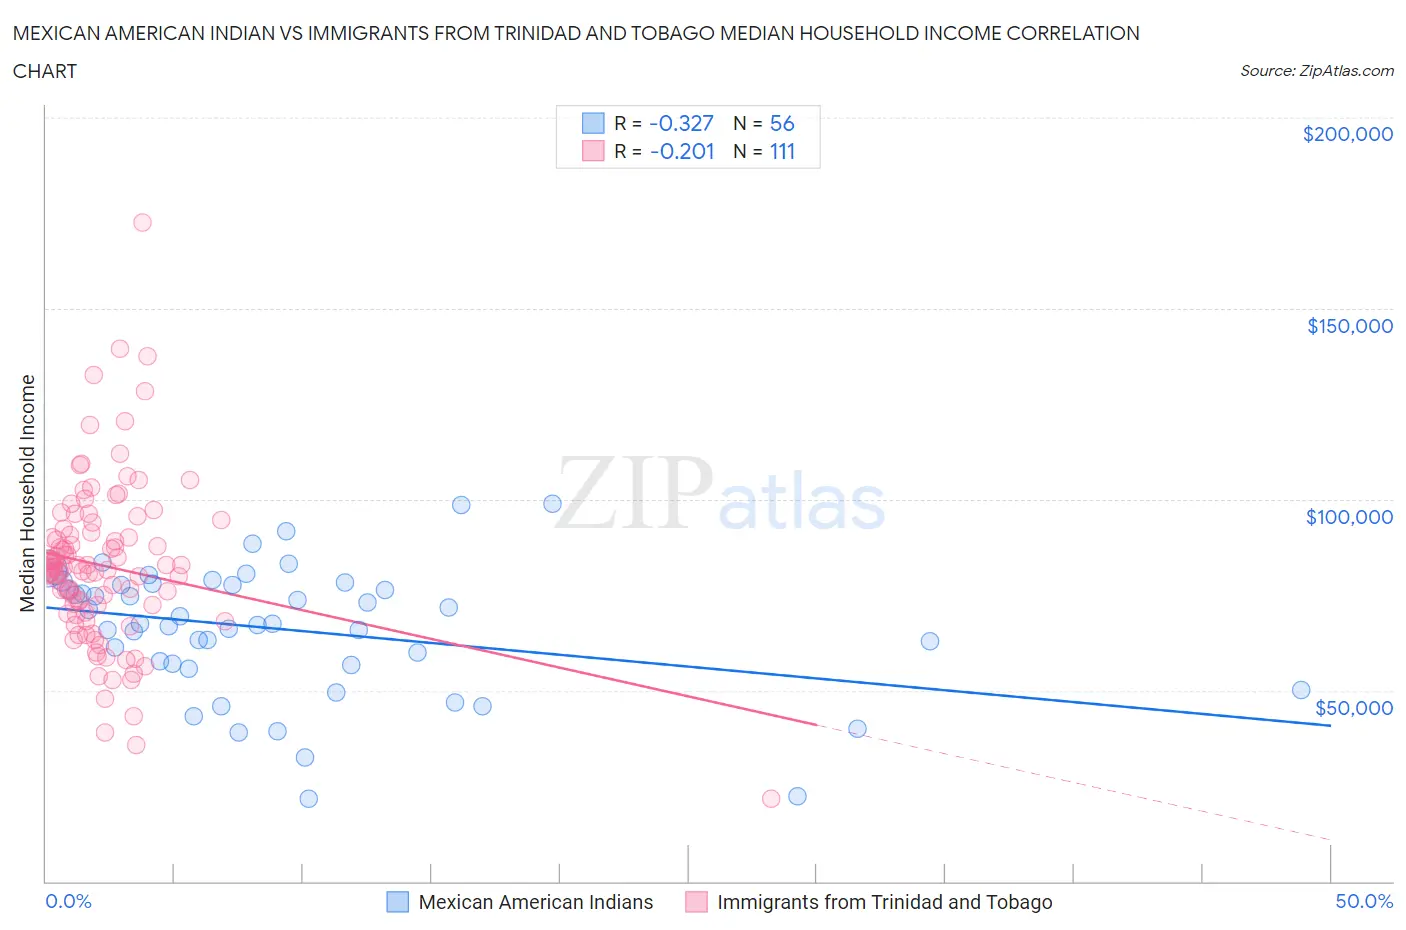
Mexican American Indian vs Immigrants from Trinidad and Tobago Median Household Income Correlation Chart
The statistical analysis conducted on geographies consisting of 317,474,541 people shows a mild negative correlation between the proportion of Mexican American Indians and median household income in the United States with a correlation coefficient (R) of -0.327 and weighted average of $78,166. Similarly, the statistical analysis conducted on geographies consisting of 223,468,612 people shows a weak negative correlation between the proportion of Immigrants from Trinidad and Tobago and median household income in the United States with a correlation coefficient (R) of -0.201 and weighted average of $80,373, a difference of 2.8%.
Median Household Income Correlation Summary
| Measurement | Mexican American Indian | Immigrants from Trinidad and Tobago |
| Minimum | $21,567 | $21,629 |
| Maximum | $98,902 | $172,500 |
| Range | $77,335 | $150,871 |
| Mean | $65,927 | $82,579 |
| Median | $67,552 | $82,052 |
| Interquartile 25% (IQ1) | $56,868 | $70,433 |
| Interquartile 75% (IQ3) | $77,810 | $91,223 |
| Interquartile Range (IQR) | $20,942 | $20,791 |
| Standard Deviation (Sample) | $17,155 | $21,636 |
| Standard Deviation (Population) | $17,001 | $21,539 |
Demographics Similar to Mexican American Indians and Immigrants from Trinidad and Tobago by Median Household Income
In terms of median household income, the demographic groups most similar to Mexican American Indians are Immigrants from Laos ($78,327, a difference of 0.21%), West Indian ($78,455, a difference of 0.37%), Sudanese ($78,529, a difference of 0.46%), Immigrants from Burma/Myanmar ($78,682, a difference of 0.66%), and Central American ($78,803, a difference of 0.82%). Similarly, the demographic groups most similar to Immigrants from Trinidad and Tobago are Immigrants from the Azores ($80,357, a difference of 0.020%), Trinidadian and Tobagonian ($80,402, a difference of 0.040%), Immigrants from Ecuador ($80,341, a difference of 0.040%), Immigrants from Guyana ($80,324, a difference of 0.060%), and Immigrants from Bosnia and Herzegovina ($79,888, a difference of 0.61%).
| Demographics | Rating | Rank | Median Household Income |
| Trinidadians and Tobagonians | 4.7 /100 | #231 | Tragic $80,402 |
| Immigrants | Trinidad and Tobago | 4.6 /100 | #232 | Tragic $80,373 |
| Immigrants | Azores | 4.5 /100 | #233 | Tragic $80,357 |
| Immigrants | Ecuador | 4.5 /100 | #234 | Tragic $80,341 |
| Immigrants | Guyana | 4.5 /100 | #235 | Tragic $80,324 |
| Immigrants | Bosnia and Herzegovina | 3.4 /100 | #236 | Tragic $79,888 |
| Nicaraguans | 3.1 /100 | #237 | Tragic $79,737 |
| Barbadians | 3.0 /100 | #238 | Tragic $79,664 |
| Alaska Natives | 2.7 /100 | #239 | Tragic $79,509 |
| Immigrants | Western Africa | 2.7 /100 | #240 | Tragic $79,490 |
| Immigrants | Nonimmigrants | 2.6 /100 | #241 | Tragic $79,429 |
| Immigrants | Sudan | 2.1 /100 | #242 | Tragic $79,103 |
| Immigrants | Barbados | 1.9 /100 | #243 | Tragic $78,989 |
| Marshallese | 1.9 /100 | #244 | Tragic $78,930 |
| Inupiat | 1.8 /100 | #245 | Tragic $78,841 |
| Central Americans | 1.7 /100 | #246 | Tragic $78,803 |
| Immigrants | Burma/Myanmar | 1.6 /100 | #247 | Tragic $78,682 |
| Sudanese | 1.5 /100 | #248 | Tragic $78,529 |
| West Indians | 1.4 /100 | #249 | Tragic $78,455 |
| Immigrants | Laos | 1.3 /100 | #250 | Tragic $78,327 |
| Mexican American Indians | 1.2 /100 | #251 | Tragic $78,166 |