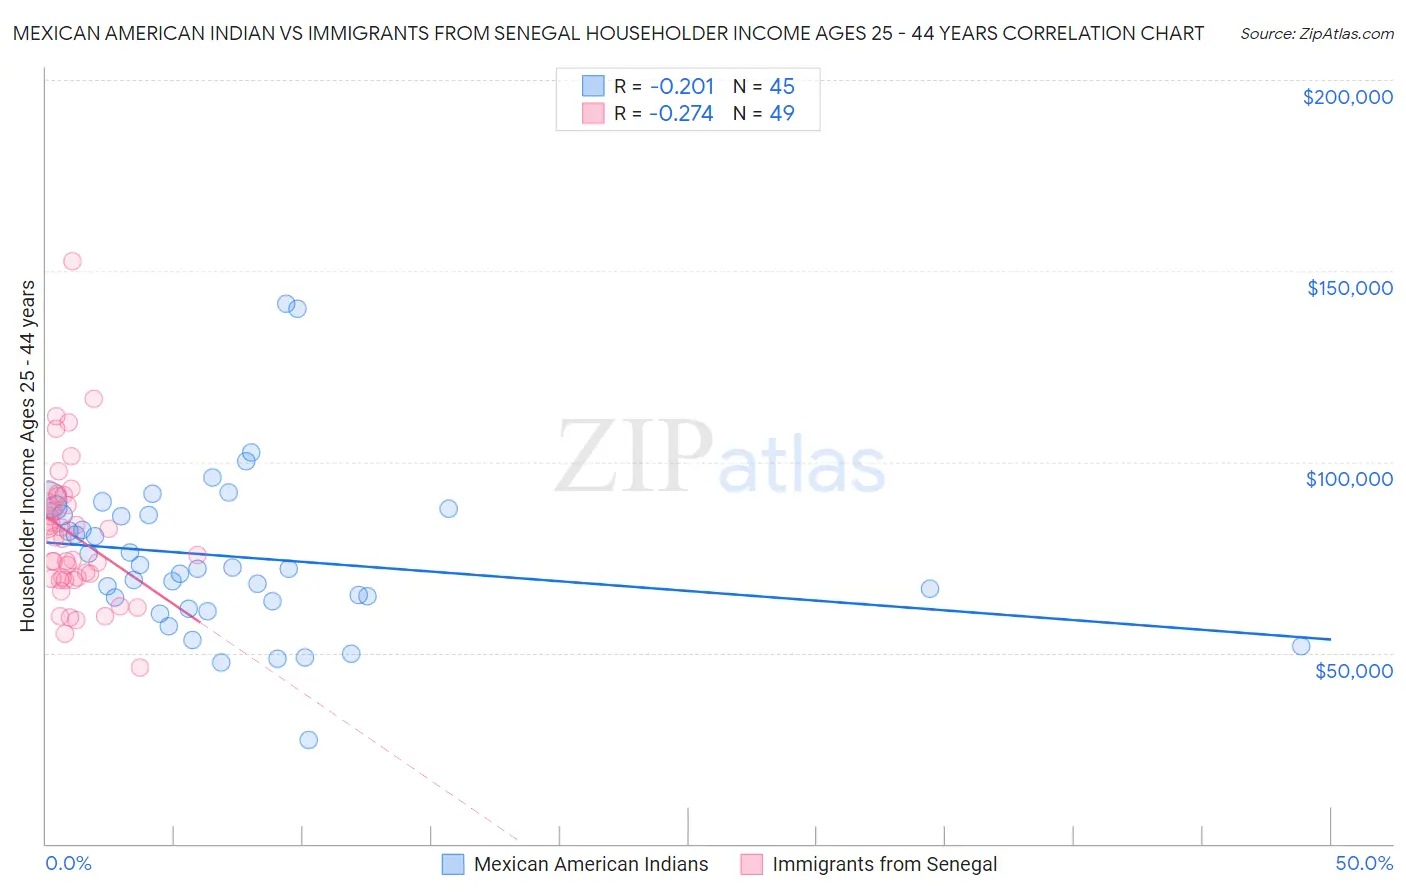
Mexican American Indian vs Immigrants from Senegal Householder Income Ages 25 - 44 years
COMPARE
Mexican American Indian
Immigrants from Senegal
Householder Income Ages 25 - 44 years
Householder Income Ages 25 - 44 years Comparison
Mexican American Indians
Immigrants from Senegal
$85,066
HOUSEHOLDER INCOME AGES 25 - 44 YEARS
0.5/ 100
METRIC RATING
257th/ 347
METRIC RANK
$84,848
HOUSEHOLDER INCOME AGES 25 - 44 YEARS
0.5/ 100
METRIC RATING
259th/ 347
METRIC RANK
Mexican American Indian vs Immigrants from Senegal Householder Income Ages 25 - 44 years Correlation Chart
The statistical analysis conducted on geographies consisting of 317,167,335 people shows a weak negative correlation between the proportion of Mexican American Indians and household income with householder between the ages 25 and 44 in the United States with a correlation coefficient (R) of -0.201 and weighted average of $85,066. Similarly, the statistical analysis conducted on geographies consisting of 90,092,145 people shows a weak negative correlation between the proportion of Immigrants from Senegal and household income with householder between the ages 25 and 44 in the United States with a correlation coefficient (R) of -0.274 and weighted average of $84,848, a difference of 0.26%.
Householder Income Ages 25 - 44 years Correlation Summary
| Measurement | Mexican American Indian | Immigrants from Senegal |
| Minimum | $27,125 | $46,250 |
| Maximum | $141,536 | $152,414 |
| Range | $114,411 | $106,164 |
| Mean | $75,117 | $80,830 |
| Median | $72,064 | $80,031 |
| Interquartile 25% (IQ1) | $62,611 | $69,279 |
| Interquartile 75% (IQ3) | $86,929 | $90,145 |
| Interquartile Range (IQR) | $24,319 | $20,867 |
| Standard Deviation (Sample) | $21,361 | $18,573 |
| Standard Deviation (Population) | $21,122 | $18,383 |
Demographics Similar to Mexican American Indians and Immigrants from Senegal by Householder Income Ages 25 - 44 years
In terms of householder income ages 25 - 44 years, the demographic groups most similar to Mexican American Indians are Central American ($85,144, a difference of 0.090%), German Russian ($85,220, a difference of 0.18%), Immigrants from Nicaragua ($84,914, a difference of 0.18%), American ($84,791, a difference of 0.32%), and Inupiat ($84,619, a difference of 0.53%). Similarly, the demographic groups most similar to Immigrants from Senegal are American ($84,791, a difference of 0.070%), Immigrants from Nicaragua ($84,914, a difference of 0.080%), Inupiat ($84,619, a difference of 0.27%), Cree ($84,574, a difference of 0.32%), and Central American ($85,144, a difference of 0.35%).
| Demographics | Rating | Rank | Householder Income Ages 25 - 44 years |
| Immigrants | Sudan | 0.9 /100 | #248 | Tragic $86,109 |
| French American Indians | 0.8 /100 | #249 | Tragic $85,899 |
| Pennsylvania Germans | 0.8 /100 | #250 | Tragic $85,836 |
| Cape Verdeans | 0.8 /100 | #251 | Tragic $85,758 |
| Immigrants | Western Africa | 0.7 /100 | #252 | Tragic $85,676 |
| British West Indians | 0.7 /100 | #253 | Tragic $85,565 |
| Immigrants | Laos | 0.7 /100 | #254 | Tragic $85,553 |
| German Russians | 0.6 /100 | #255 | Tragic $85,220 |
| Central Americans | 0.5 /100 | #256 | Tragic $85,144 |
| Mexican American Indians | 0.5 /100 | #257 | Tragic $85,066 |
| Immigrants | Nicaragua | 0.5 /100 | #258 | Tragic $84,914 |
| Immigrants | Senegal | 0.5 /100 | #259 | Tragic $84,848 |
| Americans | 0.4 /100 | #260 | Tragic $84,791 |
| Inupiat | 0.4 /100 | #261 | Tragic $84,619 |
| Cree | 0.4 /100 | #262 | Tragic $84,574 |
| Belizeans | 0.4 /100 | #263 | Tragic $84,534 |
| Osage | 0.4 /100 | #264 | Tragic $84,461 |
| Sudanese | 0.4 /100 | #265 | Tragic $84,401 |
| Immigrants | Cabo Verde | 0.3 /100 | #266 | Tragic $84,304 |
| Hmong | 0.3 /100 | #267 | Tragic $84,258 |
| Sub-Saharan Africans | 0.3 /100 | #268 | Tragic $84,235 |