Mexican American Indian vs Alaska Native Householder Income Ages 25 - 44 years
COMPARE
Mexican American Indian
Alaska Native
Householder Income Ages 25 - 44 years
Householder Income Ages 25 - 44 years Comparison
Mexican American Indians
Alaska Natives
$85,066
HOUSEHOLDER INCOME AGES 25 - 44 YEARS
0.5/ 100
METRIC RATING
257th/ 347
METRIC RANK
$88,018
HOUSEHOLDER INCOME AGES 25 - 44 YEARS
2.6/ 100
METRIC RATING
238th/ 347
METRIC RANK
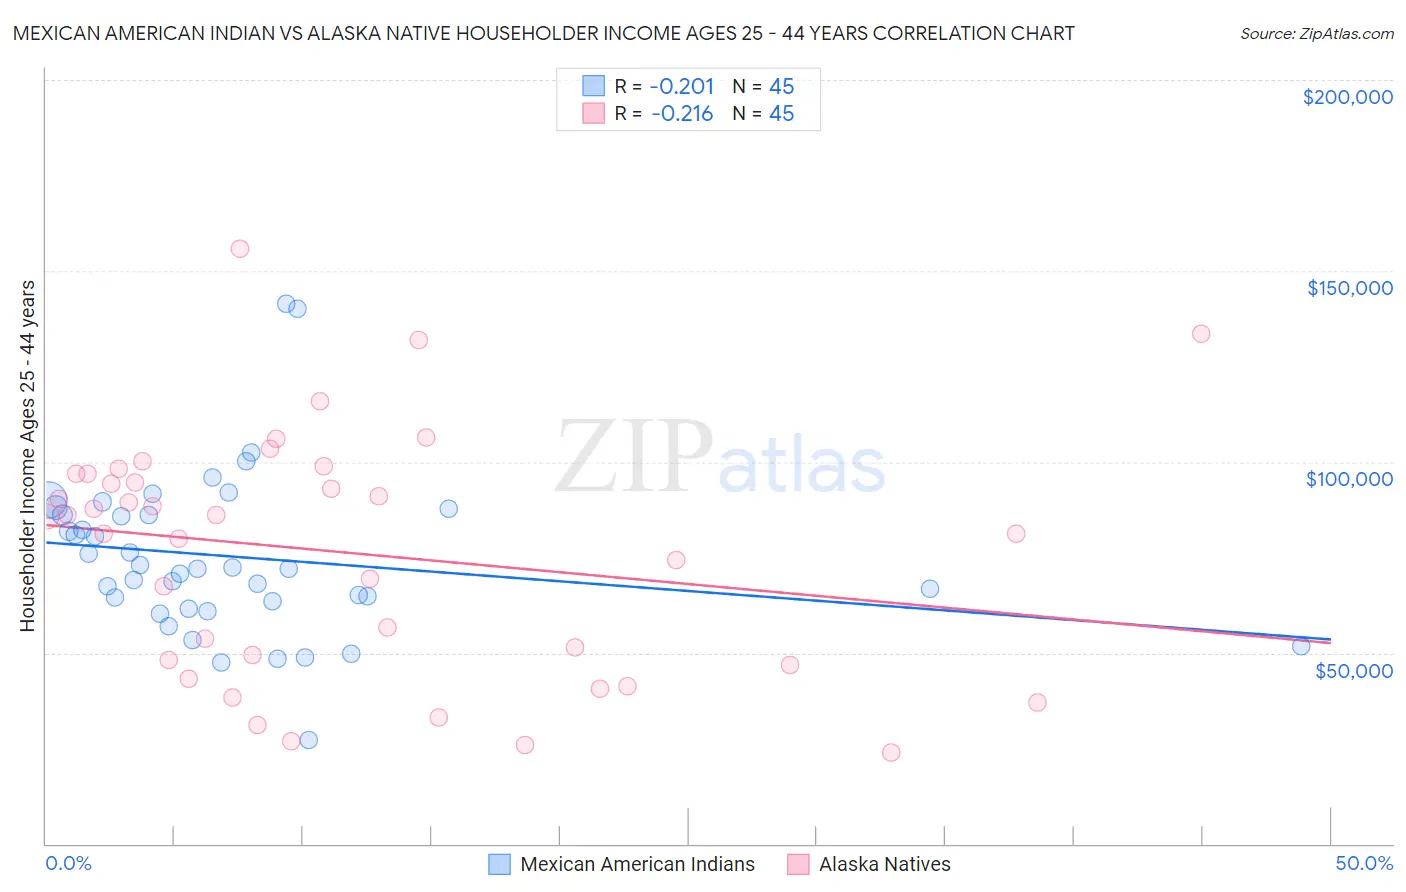
Mexican American Indian vs Alaska Native Householder Income Ages 25 - 44 years Correlation Chart
The statistical analysis conducted on geographies consisting of 317,167,335 people shows a weak negative correlation between the proportion of Mexican American Indians and household income with householder between the ages 25 and 44 in the United States with a correlation coefficient (R) of -0.201 and weighted average of $85,066. Similarly, the statistical analysis conducted on geographies consisting of 76,687,896 people shows a weak negative correlation between the proportion of Alaska Natives and household income with householder between the ages 25 and 44 in the United States with a correlation coefficient (R) of -0.216 and weighted average of $88,018, a difference of 3.5%.
Householder Income Ages 25 - 44 years Correlation Summary
| Measurement | Mexican American Indian | Alaska Native |
| Minimum | $27,125 | $23,750 |
| Maximum | $141,536 | $155,658 |
| Range | $114,411 | $131,908 |
| Mean | $75,117 | $76,232 |
| Median | $72,064 | $85,753 |
| Interquartile 25% (IQ1) | $62,611 | $47,396 |
| Interquartile 75% (IQ3) | $86,929 | $96,980 |
| Interquartile Range (IQR) | $24,319 | $49,584 |
| Standard Deviation (Sample) | $21,361 | $31,478 |
| Standard Deviation (Population) | $21,122 | $31,126 |
Demographics Similar to Mexican American Indians and Alaska Natives by Householder Income Ages 25 - 44 years
In terms of householder income ages 25 - 44 years, the demographic groups most similar to Mexican American Indians are Central American ($85,144, a difference of 0.090%), German Russian ($85,220, a difference of 0.18%), Immigrants from Laos ($85,553, a difference of 0.57%), British West Indian ($85,565, a difference of 0.59%), and Immigrants from Western Africa ($85,676, a difference of 0.72%). Similarly, the demographic groups most similar to Alaska Natives are Salvadoran ($88,198, a difference of 0.20%), Immigrants from Ghana ($87,760, a difference of 0.29%), Nicaraguan ($87,751, a difference of 0.30%), Nigerian ($87,730, a difference of 0.33%), and West Indian ($87,205, a difference of 0.93%).
| Demographics | Rating | Rank | Householder Income Ages 25 - 44 years |
| Salvadorans | 2.8 /100 | #237 | Tragic $88,198 |
| Alaska Natives | 2.6 /100 | #238 | Tragic $88,018 |
| Immigrants | Ghana | 2.2 /100 | #239 | Tragic $87,760 |
| Nicaraguans | 2.2 /100 | #240 | Tragic $87,751 |
| Nigerians | 2.2 /100 | #241 | Tragic $87,730 |
| West Indians | 1.7 /100 | #242 | Tragic $87,205 |
| Immigrants | West Indies | 1.5 /100 | #243 | Tragic $87,063 |
| Immigrants | Venezuela | 1.5 /100 | #244 | Tragic $87,038 |
| Immigrants | El Salvador | 1.4 /100 | #245 | Tragic $86,913 |
| Immigrants | Burma/Myanmar | 1.3 /100 | #246 | Tragic $86,736 |
| Immigrants | Nigeria | 1.2 /100 | #247 | Tragic $86,589 |
| Immigrants | Sudan | 0.9 /100 | #248 | Tragic $86,109 |
| French American Indians | 0.8 /100 | #249 | Tragic $85,899 |
| Pennsylvania Germans | 0.8 /100 | #250 | Tragic $85,836 |
| Cape Verdeans | 0.8 /100 | #251 | Tragic $85,758 |
| Immigrants | Western Africa | 0.7 /100 | #252 | Tragic $85,676 |
| British West Indians | 0.7 /100 | #253 | Tragic $85,565 |
| Immigrants | Laos | 0.7 /100 | #254 | Tragic $85,553 |
| German Russians | 0.6 /100 | #255 | Tragic $85,220 |
| Central Americans | 0.5 /100 | #256 | Tragic $85,144 |
| Mexican American Indians | 0.5 /100 | #257 | Tragic $85,066 |