Menominee vs Immigrants from Senegal Householder Income Ages 25 - 44 years
COMPARE
Menominee
Immigrants from Senegal
Householder Income Ages 25 - 44 years
Householder Income Ages 25 - 44 years Comparison
Menominee
Immigrants from Senegal
$79,358
HOUSEHOLDER INCOME AGES 25 - 44 YEARS
0.0/ 100
METRIC RATING
313th/ 347
METRIC RANK
$84,848
HOUSEHOLDER INCOME AGES 25 - 44 YEARS
0.5/ 100
METRIC RATING
259th/ 347
METRIC RANK
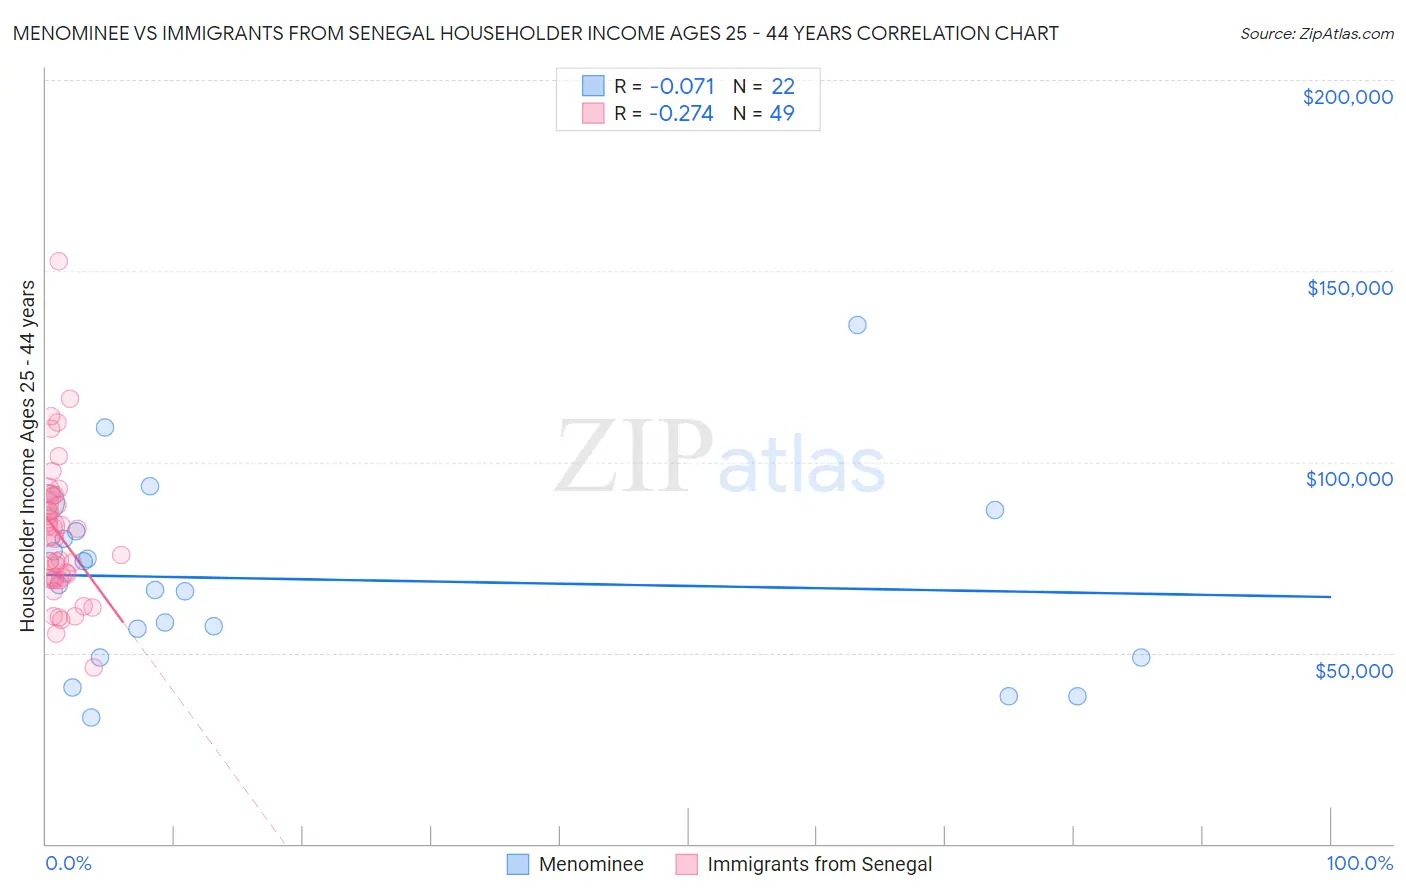
Menominee vs Immigrants from Senegal Householder Income Ages 25 - 44 years Correlation Chart
The statistical analysis conducted on geographies consisting of 45,763,833 people shows a slight negative correlation between the proportion of Menominee and household income with householder between the ages 25 and 44 in the United States with a correlation coefficient (R) of -0.071 and weighted average of $79,358. Similarly, the statistical analysis conducted on geographies consisting of 90,092,145 people shows a weak negative correlation between the proportion of Immigrants from Senegal and household income with householder between the ages 25 and 44 in the United States with a correlation coefficient (R) of -0.274 and weighted average of $84,848, a difference of 6.9%.
Householder Income Ages 25 - 44 years Correlation Summary
| Measurement | Menominee | Immigrants from Senegal |
| Minimum | $33,158 | $46,250 |
| Maximum | $135,924 | $152,414 |
| Range | $102,766 | $106,164 |
| Mean | $69,190 | $80,830 |
| Median | $66,974 | $80,031 |
| Interquartile 25% (IQ1) | $48,920 | $69,279 |
| Interquartile 75% (IQ3) | $81,800 | $90,145 |
| Interquartile Range (IQR) | $32,880 | $20,867 |
| Standard Deviation (Sample) | $24,876 | $18,573 |
| Standard Deviation (Population) | $24,304 | $18,383 |
Similar Demographics by Householder Income Ages 25 - 44 years
Demographics Similar to Menominee by Householder Income Ages 25 - 44 years
In terms of householder income ages 25 - 44 years, the demographic groups most similar to Menominee are Immigrants from Haiti ($79,391, a difference of 0.040%), Indonesian ($79,543, a difference of 0.23%), Cheyenne ($79,152, a difference of 0.26%), Ottawa ($79,012, a difference of 0.44%), and African ($78,986, a difference of 0.47%).
| Demographics | Rating | Rank | Householder Income Ages 25 - 44 years |
| Apache | 0.0 /100 | #306 | Tragic $80,260 |
| Haitians | 0.0 /100 | #307 | Tragic $80,055 |
| Immigrants | Central America | 0.0 /100 | #308 | Tragic $80,012 |
| Chippewa | 0.0 /100 | #309 | Tragic $80,005 |
| Fijians | 0.0 /100 | #310 | Tragic $79,956 |
| Indonesians | 0.0 /100 | #311 | Tragic $79,543 |
| Immigrants | Haiti | 0.0 /100 | #312 | Tragic $79,391 |
| Menominee | 0.0 /100 | #313 | Tragic $79,358 |
| Cheyenne | 0.0 /100 | #314 | Tragic $79,152 |
| Ottawa | 0.0 /100 | #315 | Tragic $79,012 |
| Africans | 0.0 /100 | #316 | Tragic $78,986 |
| U.S. Virgin Islanders | 0.0 /100 | #317 | Tragic $78,911 |
| Immigrants | Mexico | 0.0 /100 | #318 | Tragic $78,809 |
| Hondurans | 0.0 /100 | #319 | Tragic $78,540 |
| Choctaw | 0.0 /100 | #320 | Tragic $78,168 |
Demographics Similar to Immigrants from Senegal by Householder Income Ages 25 - 44 years
In terms of householder income ages 25 - 44 years, the demographic groups most similar to Immigrants from Senegal are American ($84,791, a difference of 0.070%), Immigrants from Nicaragua ($84,914, a difference of 0.080%), Mexican American Indian ($85,066, a difference of 0.26%), Inupiat ($84,619, a difference of 0.27%), and Cree ($84,574, a difference of 0.32%).
| Demographics | Rating | Rank | Householder Income Ages 25 - 44 years |
| Immigrants | Western Africa | 0.7 /100 | #252 | Tragic $85,676 |
| British West Indians | 0.7 /100 | #253 | Tragic $85,565 |
| Immigrants | Laos | 0.7 /100 | #254 | Tragic $85,553 |
| German Russians | 0.6 /100 | #255 | Tragic $85,220 |
| Central Americans | 0.5 /100 | #256 | Tragic $85,144 |
| Mexican American Indians | 0.5 /100 | #257 | Tragic $85,066 |
| Immigrants | Nicaragua | 0.5 /100 | #258 | Tragic $84,914 |
| Immigrants | Senegal | 0.5 /100 | #259 | Tragic $84,848 |
| Americans | 0.4 /100 | #260 | Tragic $84,791 |
| Inupiat | 0.4 /100 | #261 | Tragic $84,619 |
| Cree | 0.4 /100 | #262 | Tragic $84,574 |
| Belizeans | 0.4 /100 | #263 | Tragic $84,534 |
| Osage | 0.4 /100 | #264 | Tragic $84,461 |
| Sudanese | 0.4 /100 | #265 | Tragic $84,401 |
| Immigrants | Cabo Verde | 0.3 /100 | #266 | Tragic $84,304 |