Mexican American Indian vs Celtic Householder Income Ages 25 - 44 years
COMPARE
Mexican American Indian
Celtic
Householder Income Ages 25 - 44 years
Householder Income Ages 25 - 44 years Comparison
Mexican American Indians
Celtics
$85,066
HOUSEHOLDER INCOME AGES 25 - 44 YEARS
0.5/ 100
METRIC RATING
257th/ 347
METRIC RANK
$92,241
HOUSEHOLDER INCOME AGES 25 - 44 YEARS
21.6/ 100
METRIC RATING
195th/ 347
METRIC RANK
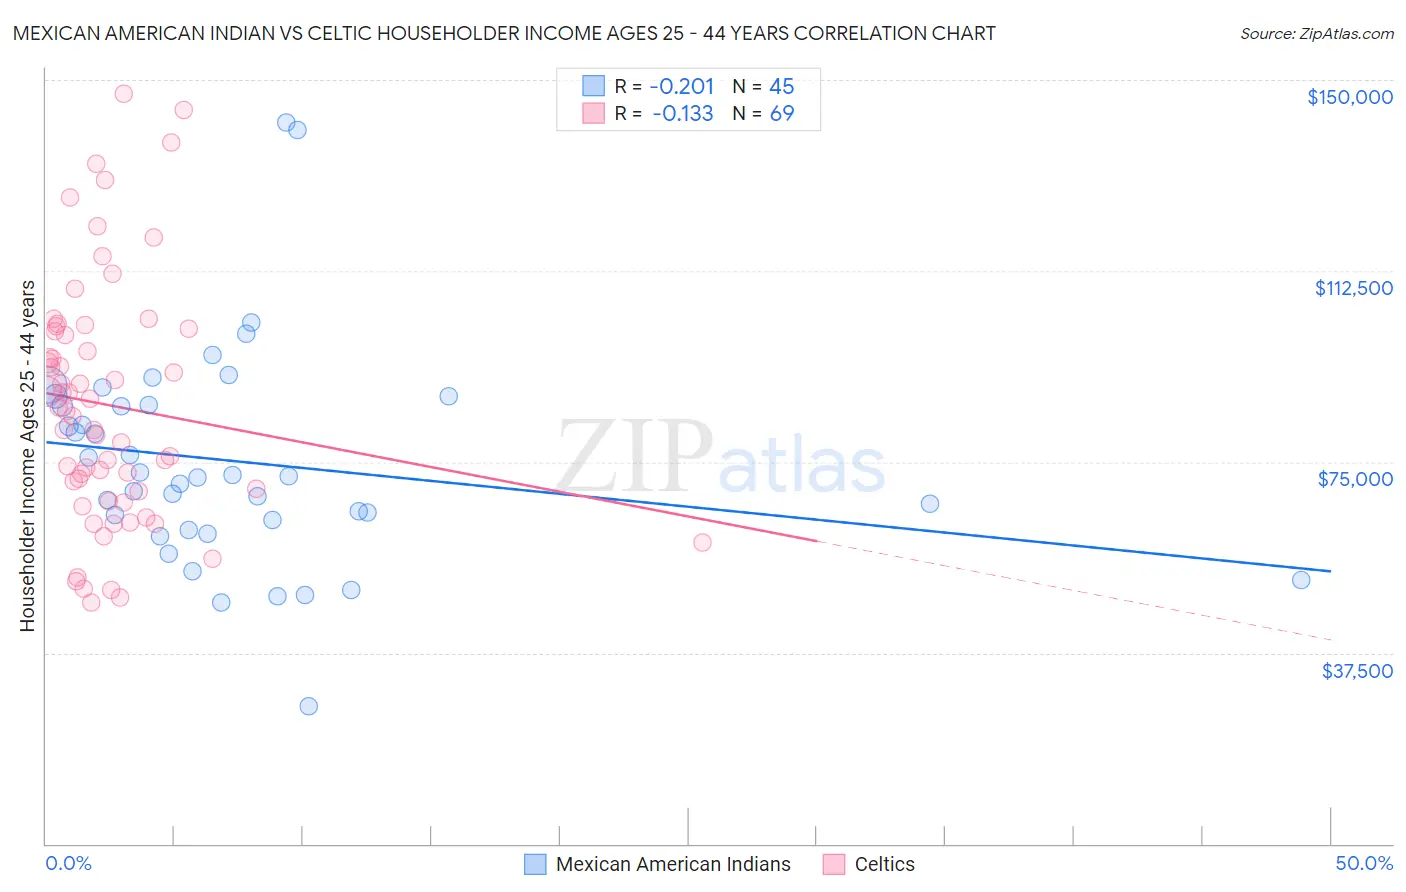
Mexican American Indian vs Celtic Householder Income Ages 25 - 44 years Correlation Chart
The statistical analysis conducted on geographies consisting of 317,167,335 people shows a weak negative correlation between the proportion of Mexican American Indians and household income with householder between the ages 25 and 44 in the United States with a correlation coefficient (R) of -0.201 and weighted average of $85,066. Similarly, the statistical analysis conducted on geographies consisting of 168,638,576 people shows a poor negative correlation between the proportion of Celtics and household income with householder between the ages 25 and 44 in the United States with a correlation coefficient (R) of -0.133 and weighted average of $92,241, a difference of 8.4%.
Householder Income Ages 25 - 44 years Correlation Summary
| Measurement | Mexican American Indian | Celtic |
| Minimum | $27,125 | $47,456 |
| Maximum | $141,536 | $147,258 |
| Range | $114,411 | $99,801 |
| Mean | $75,117 | $86,089 |
| Median | $72,064 | $84,960 |
| Interquartile 25% (IQ1) | $62,611 | $68,316 |
| Interquartile 75% (IQ3) | $86,929 | $100,916 |
| Interquartile Range (IQR) | $24,319 | $32,600 |
| Standard Deviation (Sample) | $21,361 | $23,857 |
| Standard Deviation (Population) | $21,122 | $23,683 |
Similar Demographics by Householder Income Ages 25 - 44 years
Demographics Similar to Mexican American Indians by Householder Income Ages 25 - 44 years
In terms of householder income ages 25 - 44 years, the demographic groups most similar to Mexican American Indians are Central American ($85,144, a difference of 0.090%), German Russian ($85,220, a difference of 0.18%), Immigrants from Nicaragua ($84,914, a difference of 0.18%), Immigrants from Senegal ($84,848, a difference of 0.26%), and American ($84,791, a difference of 0.32%).
| Demographics | Rating | Rank | Householder Income Ages 25 - 44 years |
| Pennsylvania Germans | 0.8 /100 | #250 | Tragic $85,836 |
| Cape Verdeans | 0.8 /100 | #251 | Tragic $85,758 |
| Immigrants | Western Africa | 0.7 /100 | #252 | Tragic $85,676 |
| British West Indians | 0.7 /100 | #253 | Tragic $85,565 |
| Immigrants | Laos | 0.7 /100 | #254 | Tragic $85,553 |
| German Russians | 0.6 /100 | #255 | Tragic $85,220 |
| Central Americans | 0.5 /100 | #256 | Tragic $85,144 |
| Mexican American Indians | 0.5 /100 | #257 | Tragic $85,066 |
| Immigrants | Nicaragua | 0.5 /100 | #258 | Tragic $84,914 |
| Immigrants | Senegal | 0.5 /100 | #259 | Tragic $84,848 |
| Americans | 0.4 /100 | #260 | Tragic $84,791 |
| Inupiat | 0.4 /100 | #261 | Tragic $84,619 |
| Cree | 0.4 /100 | #262 | Tragic $84,574 |
| Belizeans | 0.4 /100 | #263 | Tragic $84,534 |
| Osage | 0.4 /100 | #264 | Tragic $84,461 |
Demographics Similar to Celtics by Householder Income Ages 25 - 44 years
In terms of householder income ages 25 - 44 years, the demographic groups most similar to Celtics are Immigrants from Colombia ($92,204, a difference of 0.040%), Spanish ($92,200, a difference of 0.040%), Immigrants from the Azores ($92,322, a difference of 0.090%), Samoan ($92,385, a difference of 0.16%), and Vietnamese ($92,089, a difference of 0.16%).
| Demographics | Rating | Rank | Householder Income Ages 25 - 44 years |
| Immigrants | Sierra Leone | 30.9 /100 | #188 | Fair $93,115 |
| Dutch | 30.5 /100 | #189 | Fair $93,081 |
| Welsh | 30.0 /100 | #190 | Fair $93,039 |
| Tlingit-Haida | 29.4 /100 | #191 | Fair $92,987 |
| Immigrants | Costa Rica | 28.2 /100 | #192 | Fair $92,876 |
| Samoans | 23.0 /100 | #193 | Fair $92,385 |
| Immigrants | Azores | 22.4 /100 | #194 | Fair $92,322 |
| Celtics | 21.6 /100 | #195 | Fair $92,241 |
| Immigrants | Colombia | 21.3 /100 | #196 | Fair $92,204 |
| Spanish | 21.2 /100 | #197 | Fair $92,200 |
| Vietnamese | 20.2 /100 | #198 | Fair $92,089 |
| Kenyans | 16.8 /100 | #199 | Poor $91,684 |
| Whites/Caucasians | 16.7 /100 | #200 | Poor $91,668 |
| Japanese | 16.4 /100 | #201 | Poor $91,624 |
| Ecuadorians | 16.0 /100 | #202 | Poor $91,574 |