Mexican American Indian vs Immigrants from Italy Householder Income Ages 25 - 44 years
COMPARE
Mexican American Indian
Immigrants from Italy
Householder Income Ages 25 - 44 years
Householder Income Ages 25 - 44 years Comparison
Mexican American Indians
Immigrants from Italy
$85,066
HOUSEHOLDER INCOME AGES 25 - 44 YEARS
0.5/ 100
METRIC RATING
257th/ 347
METRIC RANK
$105,201
HOUSEHOLDER INCOME AGES 25 - 44 YEARS
99.7/ 100
METRIC RATING
62nd/ 347
METRIC RANK
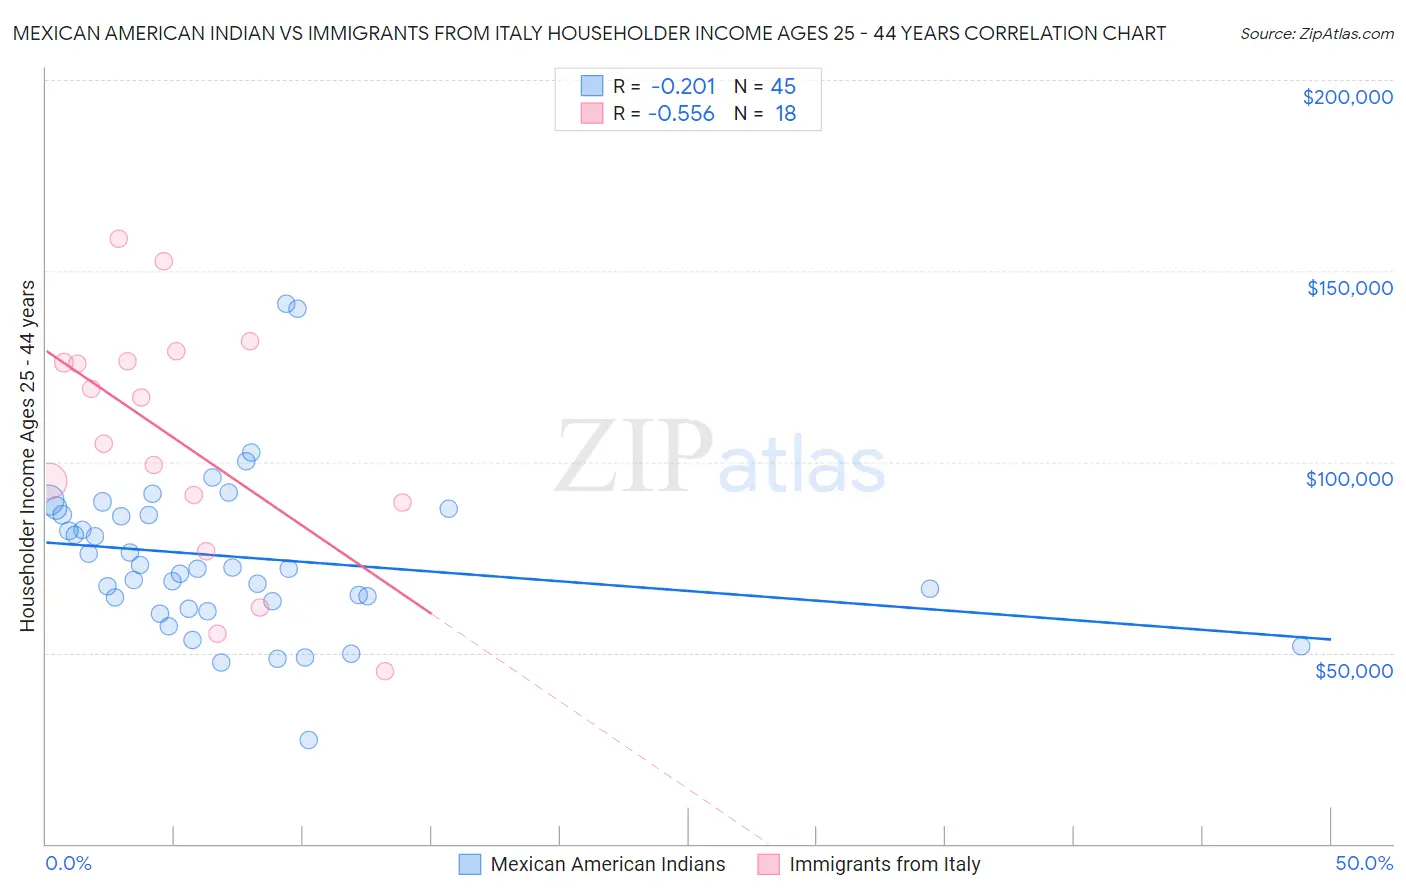
Mexican American Indian vs Immigrants from Italy Householder Income Ages 25 - 44 years Correlation Chart
The statistical analysis conducted on geographies consisting of 317,167,335 people shows a weak negative correlation between the proportion of Mexican American Indians and household income with householder between the ages 25 and 44 in the United States with a correlation coefficient (R) of -0.201 and weighted average of $85,066. Similarly, the statistical analysis conducted on geographies consisting of 323,420,404 people shows a substantial negative correlation between the proportion of Immigrants from Italy and household income with householder between the ages 25 and 44 in the United States with a correlation coefficient (R) of -0.556 and weighted average of $105,201, a difference of 23.7%.
Householder Income Ages 25 - 44 years Correlation Summary
| Measurement | Mexican American Indian | Immigrants from Italy |
| Minimum | $27,125 | $45,256 |
| Maximum | $141,536 | $158,531 |
| Range | $114,411 | $113,275 |
| Mean | $75,117 | $105,762 |
| Median | $72,064 | $110,729 |
| Interquartile 25% (IQ1) | $62,611 | $89,375 |
| Interquartile 75% (IQ3) | $86,929 | $126,307 |
| Interquartile Range (IQR) | $24,319 | $36,932 |
| Standard Deviation (Sample) | $21,361 | $31,956 |
| Standard Deviation (Population) | $21,122 | $31,055 |
Similar Demographics by Householder Income Ages 25 - 44 years
Demographics Similar to Mexican American Indians by Householder Income Ages 25 - 44 years
In terms of householder income ages 25 - 44 years, the demographic groups most similar to Mexican American Indians are Central American ($85,144, a difference of 0.090%), German Russian ($85,220, a difference of 0.18%), Immigrants from Nicaragua ($84,914, a difference of 0.18%), Immigrants from Senegal ($84,848, a difference of 0.26%), and American ($84,791, a difference of 0.32%).
| Demographics | Rating | Rank | Householder Income Ages 25 - 44 years |
| Pennsylvania Germans | 0.8 /100 | #250 | Tragic $85,836 |
| Cape Verdeans | 0.8 /100 | #251 | Tragic $85,758 |
| Immigrants | Western Africa | 0.7 /100 | #252 | Tragic $85,676 |
| British West Indians | 0.7 /100 | #253 | Tragic $85,565 |
| Immigrants | Laos | 0.7 /100 | #254 | Tragic $85,553 |
| German Russians | 0.6 /100 | #255 | Tragic $85,220 |
| Central Americans | 0.5 /100 | #256 | Tragic $85,144 |
| Mexican American Indians | 0.5 /100 | #257 | Tragic $85,066 |
| Immigrants | Nicaragua | 0.5 /100 | #258 | Tragic $84,914 |
| Immigrants | Senegal | 0.5 /100 | #259 | Tragic $84,848 |
| Americans | 0.4 /100 | #260 | Tragic $84,791 |
| Inupiat | 0.4 /100 | #261 | Tragic $84,619 |
| Cree | 0.4 /100 | #262 | Tragic $84,574 |
| Belizeans | 0.4 /100 | #263 | Tragic $84,534 |
| Osage | 0.4 /100 | #264 | Tragic $84,461 |
Demographics Similar to Immigrants from Italy by Householder Income Ages 25 - 44 years
In terms of householder income ages 25 - 44 years, the demographic groups most similar to Immigrants from Italy are Lithuanian ($105,223, a difference of 0.020%), Egyptian ($105,282, a difference of 0.080%), Immigrants from Scotland ($105,089, a difference of 0.11%), New Zealander ($105,085, a difference of 0.11%), and Immigrants from Netherlands ($105,082, a difference of 0.11%).
| Demographics | Rating | Rank | Householder Income Ages 25 - 44 years |
| Greeks | 99.9 /100 | #55 | Exceptional $106,457 |
| Immigrants | Pakistan | 99.8 /100 | #56 | Exceptional $106,129 |
| Immigrants | Austria | 99.8 /100 | #57 | Exceptional $106,103 |
| Immigrants | South Africa | 99.8 /100 | #58 | Exceptional $105,748 |
| Immigrants | Latvia | 99.8 /100 | #59 | Exceptional $105,522 |
| Egyptians | 99.7 /100 | #60 | Exceptional $105,282 |
| Lithuanians | 99.7 /100 | #61 | Exceptional $105,223 |
| Immigrants | Italy | 99.7 /100 | #62 | Exceptional $105,201 |
| Immigrants | Scotland | 99.7 /100 | #63 | Exceptional $105,089 |
| New Zealanders | 99.7 /100 | #64 | Exceptional $105,085 |
| Immigrants | Netherlands | 99.7 /100 | #65 | Exceptional $105,082 |
| Laotians | 99.7 /100 | #66 | Exceptional $104,993 |
| Immigrants | Romania | 99.6 /100 | #67 | Exceptional $104,713 |
| Immigrants | Eastern Europe | 99.6 /100 | #68 | Exceptional $104,662 |
| Mongolians | 99.6 /100 | #69 | Exceptional $104,578 |