Mexican American Indian vs Immigrants from Senegal Disability Age 35 to 64
COMPARE
Mexican American Indian
Immigrants from Senegal
Disability Age 35 to 64
Disability Age 35 to 64 Comparison
Mexican American Indians
Immigrants from Senegal
12.0%
DISABILITY AGE 35 TO 64
3.2/ 100
METRIC RATING
241st/ 347
METRIC RANK
12.2%
DISABILITY AGE 35 TO 64
1.3/ 100
METRIC RATING
247th/ 347
METRIC RANK
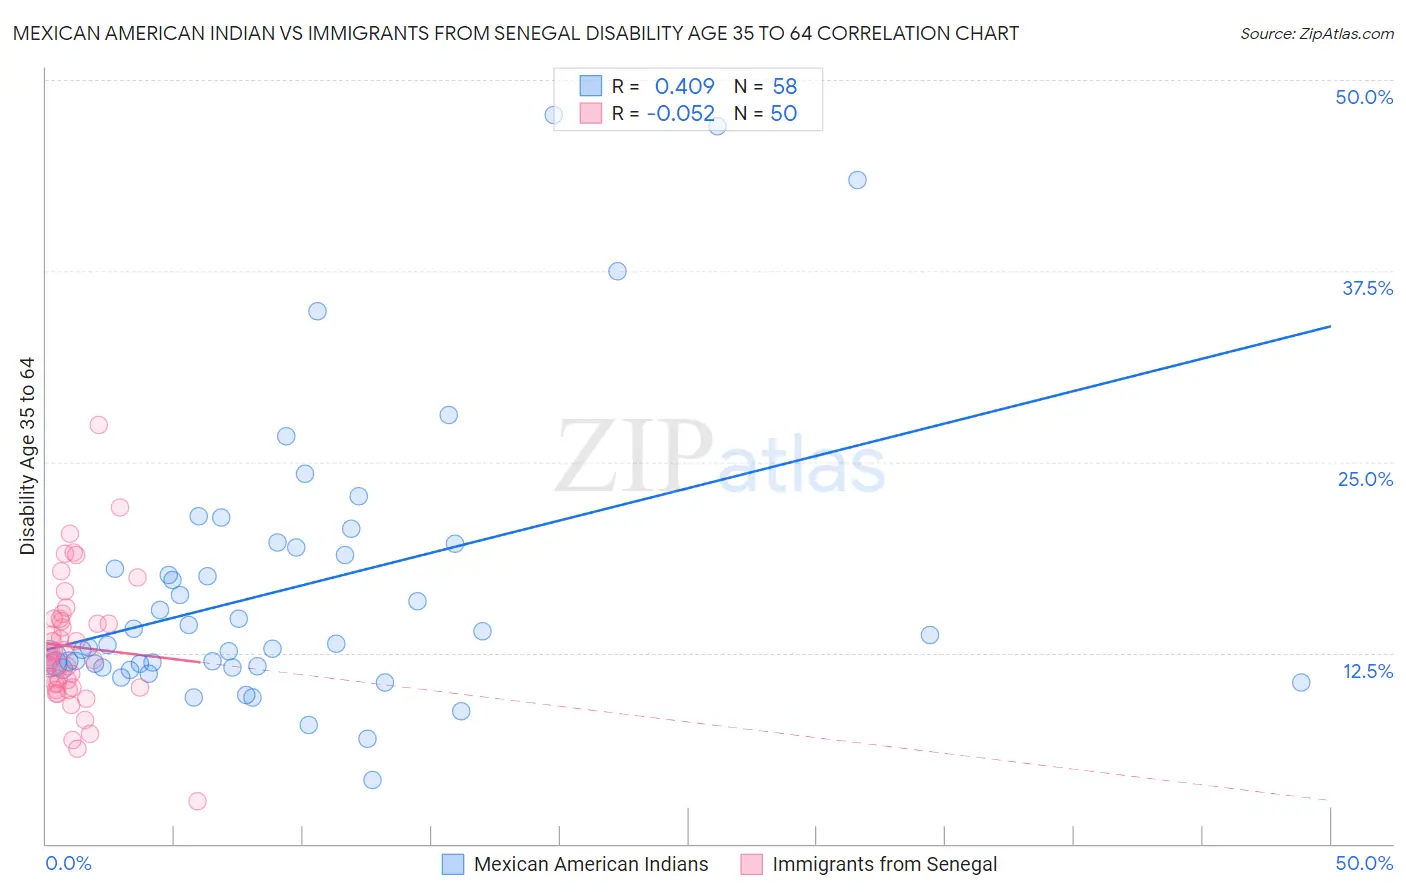
Mexican American Indian vs Immigrants from Senegal Disability Age 35 to 64 Correlation Chart
The statistical analysis conducted on geographies consisting of 317,491,587 people shows a moderate positive correlation between the proportion of Mexican American Indians and percentage of population with a disability between the ages 34 and 64 in the United States with a correlation coefficient (R) of 0.409 and weighted average of 12.0%. Similarly, the statistical analysis conducted on geographies consisting of 90,123,819 people shows a slight negative correlation between the proportion of Immigrants from Senegal and percentage of population with a disability between the ages 34 and 64 in the United States with a correlation coefficient (R) of -0.052 and weighted average of 12.2%, a difference of 1.7%.
Disability Age 35 to 64 Correlation Summary
| Measurement | Mexican American Indian | Immigrants from Senegal |
| Minimum | 4.2% | 2.8% |
| Maximum | 47.7% | 27.4% |
| Range | 43.6% | 24.6% |
| Mean | 16.7% | 12.9% |
| Median | 13.1% | 12.2% |
| Interquartile 25% (IQ1) | 11.6% | 10.2% |
| Interquartile 75% (IQ3) | 19.4% | 14.7% |
| Interquartile Range (IQR) | 7.8% | 4.5% |
| Standard Deviation (Sample) | 9.3% | 4.3% |
| Standard Deviation (Population) | 9.2% | 4.2% |
Demographics Similar to Mexican American Indians and Immigrants from Senegal by Disability Age 35 to 64
In terms of disability age 35 to 64, the demographic groups most similar to Mexican American Indians are Immigrants from Western Africa (12.0%, a difference of 0.030%), Immigrants from Thailand (12.0%, a difference of 0.030%), Samoan (12.1%, a difference of 0.27%), West Indian (12.0%, a difference of 0.29%), and Slovak (12.1%, a difference of 0.37%). Similarly, the demographic groups most similar to Immigrants from Senegal are Guamanian/Chamorro (12.2%, a difference of 0.040%), Spaniard (12.3%, a difference of 0.10%), Hispanic or Latino (12.3%, a difference of 0.12%), Immigrants from Burma/Myanmar (12.3%, a difference of 0.26%), and German (12.3%, a difference of 0.33%).
| Demographics | Rating | Rank | Disability Age 35 to 64 |
| Portuguese | 4.9 /100 | #234 | Tragic 11.9% |
| Belizeans | 4.5 /100 | #235 | Tragic 12.0% |
| Immigrants | Middle Africa | 4.5 /100 | #236 | Tragic 12.0% |
| Immigrants | Cambodia | 3.9 /100 | #237 | Tragic 12.0% |
| West Indians | 3.7 /100 | #238 | Tragic 12.0% |
| Immigrants | Western Africa | 3.3 /100 | #239 | Tragic 12.0% |
| Immigrants | Thailand | 3.3 /100 | #240 | Tragic 12.0% |
| Mexican American Indians | 3.2 /100 | #241 | Tragic 12.0% |
| Samoans | 2.8 /100 | #242 | Tragic 12.1% |
| Slovaks | 2.7 /100 | #243 | Tragic 12.1% |
| Finns | 2.3 /100 | #244 | Tragic 12.1% |
| Immigrants | Mexico | 2.2 /100 | #245 | Tragic 12.1% |
| Guamanians/Chamorros | 1.4 /100 | #246 | Tragic 12.2% |
| Immigrants | Senegal | 1.3 /100 | #247 | Tragic 12.2% |
| Spaniards | 1.3 /100 | #248 | Tragic 12.3% |
| Hispanics or Latinos | 1.3 /100 | #249 | Tragic 12.3% |
| Immigrants | Burma/Myanmar | 1.2 /100 | #250 | Tragic 12.3% |
| Germans | 1.1 /100 | #251 | Tragic 12.3% |
| Irish | 1.0 /100 | #252 | Tragic 12.3% |
| Dutch | 1.0 /100 | #253 | Tragic 12.3% |
| Hawaiians | 0.9 /100 | #254 | Tragic 12.3% |