Mexican American Indian vs Immigrants from Senegal Male Disability
COMPARE
Mexican American Indian
Immigrants from Senegal
Male Disability
Male Disability Comparison
Mexican American Indians
Immigrants from Senegal
11.6%
MALE DISABILITY
7.8/ 100
METRIC RATING
213th/ 347
METRIC RANK
11.3%
MALE DISABILITY
34.4/ 100
METRIC RATING
181st/ 347
METRIC RANK
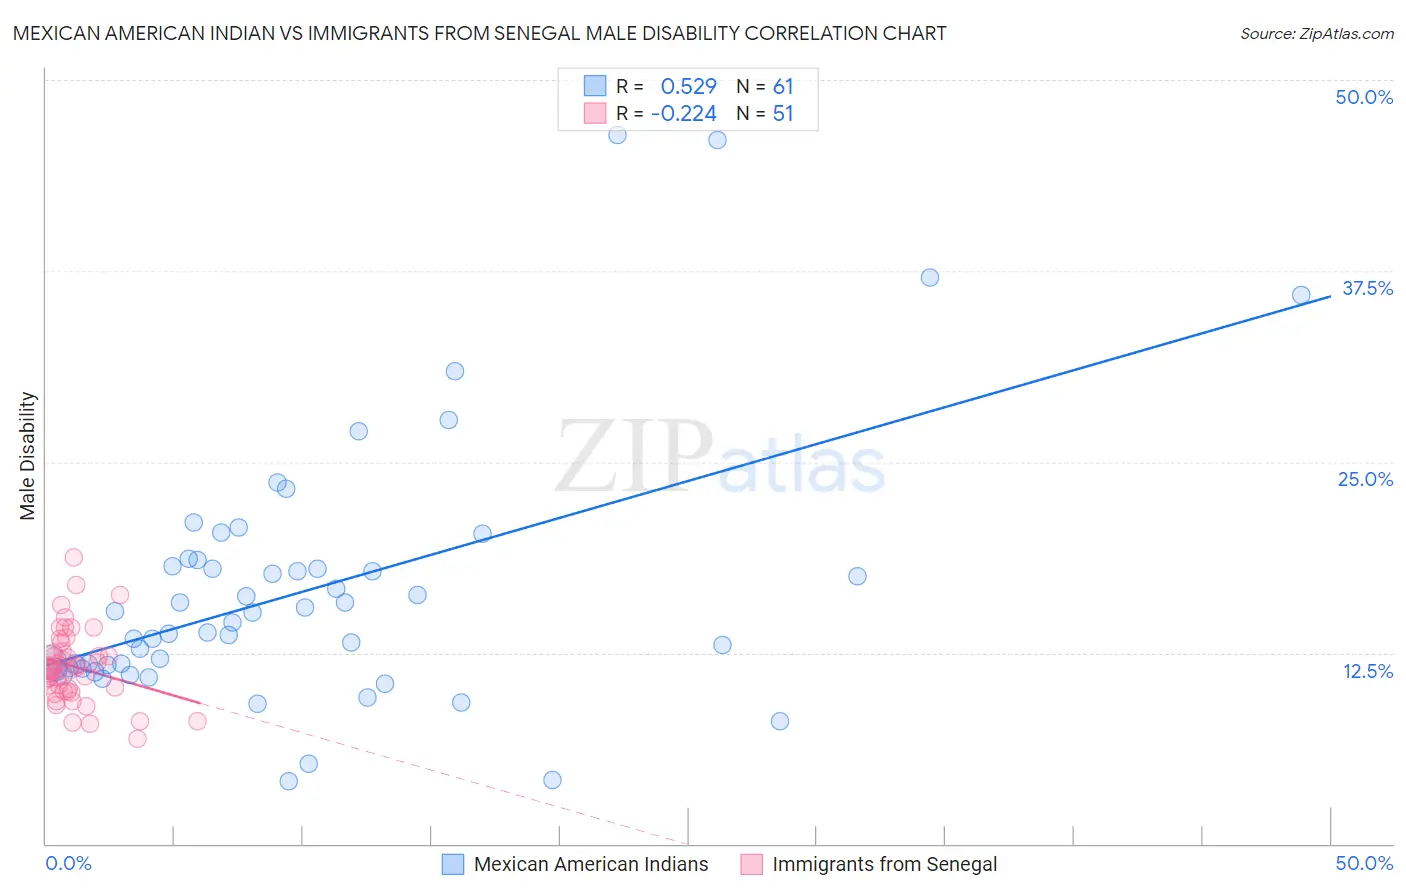
Mexican American Indian vs Immigrants from Senegal Male Disability Correlation Chart
The statistical analysis conducted on geographies consisting of 317,563,584 people shows a substantial positive correlation between the proportion of Mexican American Indians and percentage of males with a disability in the United States with a correlation coefficient (R) of 0.529 and weighted average of 11.6%. Similarly, the statistical analysis conducted on geographies consisting of 90,127,503 people shows a weak negative correlation between the proportion of Immigrants from Senegal and percentage of males with a disability in the United States with a correlation coefficient (R) of -0.224 and weighted average of 11.3%, a difference of 2.5%.
Male Disability Correlation Summary
| Measurement | Mexican American Indian | Immigrants from Senegal |
| Minimum | 4.1% | 6.9% |
| Maximum | 46.4% | 18.7% |
| Range | 42.3% | 11.8% |
| Mean | 16.6% | 11.6% |
| Median | 14.5% | 11.4% |
| Interquartile 25% (IQ1) | 11.5% | 10.0% |
| Interquartile 75% (IQ3) | 18.4% | 12.6% |
| Interquartile Range (IQR) | 6.8% | 2.6% |
| Standard Deviation (Sample) | 8.5% | 2.4% |
| Standard Deviation (Population) | 8.4% | 2.4% |
Similar Demographics by Male Disability
Demographics Similar to Mexican American Indians by Male Disability
In terms of male disability, the demographic groups most similar to Mexican American Indians are Immigrants from Scotland (11.6%, a difference of 0.080%), Immigrants from Thailand (11.6%, a difference of 0.10%), Lithuanian (11.6%, a difference of 0.24%), Ute (11.6%, a difference of 0.28%), and Spanish American Indian (11.6%, a difference of 0.37%).
| Demographics | Rating | Rank | Male Disability |
| Ukrainians | 10.6 /100 | #206 | Poor 11.5% |
| Immigrants | Somalia | 10.4 /100 | #207 | Poor 11.5% |
| Icelanders | 10.1 /100 | #208 | Poor 11.6% |
| Spanish American Indians | 10.1 /100 | #209 | Poor 11.6% |
| Ute | 9.4 /100 | #210 | Tragic 11.6% |
| Immigrants | Thailand | 8.4 /100 | #211 | Tragic 11.6% |
| Immigrants | Scotland | 8.2 /100 | #212 | Tragic 11.6% |
| Mexican American Indians | 7.8 /100 | #213 | Tragic 11.6% |
| Lithuanians | 6.6 /100 | #214 | Tragic 11.6% |
| Indonesians | 5.9 /100 | #215 | Tragic 11.6% |
| Immigrants | Dominican Republic | 4.9 /100 | #216 | Tragic 11.7% |
| Immigrants | Dominica | 4.6 /100 | #217 | Tragic 11.7% |
| Immigrants | England | 4.0 /100 | #218 | Tragic 11.7% |
| Panamanians | 3.8 /100 | #219 | Tragic 11.7% |
| Immigrants | Western Europe | 3.8 /100 | #220 | Tragic 11.7% |
Demographics Similar to Immigrants from Senegal by Male Disability
In terms of male disability, the demographic groups most similar to Immigrants from Senegal are Immigrants from Belize (11.3%, a difference of 0.040%), Immigrants from Central America (11.3%, a difference of 0.090%), Iraqi (11.3%, a difference of 0.24%), Pakistani (11.3%, a difference of 0.25%), and Honduran (11.3%, a difference of 0.40%).
| Demographics | Rating | Rank | Male Disability |
| Maltese | 50.0 /100 | #174 | Average 11.2% |
| Immigrants | Honduras | 48.7 /100 | #175 | Average 11.2% |
| Syrians | 46.6 /100 | #176 | Average 11.2% |
| Immigrants | Norway | 44.2 /100 | #177 | Average 11.3% |
| Australians | 42.2 /100 | #178 | Average 11.3% |
| Immigrants | Caribbean | 41.4 /100 | #179 | Average 11.3% |
| Hondurans | 41.1 /100 | #180 | Average 11.3% |
| Immigrants | Senegal | 34.4 /100 | #181 | Fair 11.3% |
| Immigrants | Belize | 33.7 /100 | #182 | Fair 11.3% |
| Immigrants | Central America | 32.9 /100 | #183 | Fair 11.3% |
| Iraqis | 30.5 /100 | #184 | Fair 11.3% |
| Pakistanis | 30.3 /100 | #185 | Fair 11.3% |
| Immigrants | Zaire | 27.6 /100 | #186 | Fair 11.4% |
| Immigrants | Austria | 27.3 /100 | #187 | Fair 11.4% |
| Estonians | 26.8 /100 | #188 | Fair 11.4% |