Mexican American Indian vs Immigrants from Israel Householder Income Ages 25 - 44 years

COMPARE

Mexican American Indian
Race
Ancestry
AfghanAfricanAlaska NativeAlaskan AthabascanAlbanianAleutAlsatianAmericanApacheArabArapahoArgentineanArmenianAssyrian/Chaldean/SyriacAustralianAustrianBahamianBangladeshiBarbadianBasqueBelgianBelizeanBermudanBhutaneseBlackfeetBolivianBrazilianBritishBritish West IndianBulgarianBurmeseCajunCambodianCanadianCape VerdeanCarpatho RusynCelticCentral AmericanCentral American IndianCherokeeCheyenneChickasawChileanChineseChippewaChoctawColombianColvilleComancheCosta RicanCreeCreekCroatianCrowCubanCypriotCzechCzechoslovakianDanishDelawareDominicanDutchDutch West IndianEastern EuropeanEcuadorianEgyptianEnglishEstonianEthiopianEuropeanFijianFilipinoFinnishFrenchFrench American IndianFrench CanadianGermanGerman RussianGhanaianGreekGuamanian/ChamorroGuatemalanGuyaneseHaitianHmongHonduranHopiHoumaHungarianIcelanderIndian (Asian)IndonesianInupiatIranianIraqiIrishIroquoisIsraeliItalianJamaicanJapaneseJordanianKenyanKiowaKoreanLaotianLatvianLebaneseLiberianLithuanianLumbeeLuxembourgerMacedonianMalaysianMalteseMarshalleseMenomineeMexicanMexican American IndianMongolianMoroccanNative HawaiianNavajoNepaleseNew ZealanderNicaraguanNigerianNorthern EuropeanNorwegianOkinawanOsageOttawaPaiutePakistaniPalestinianPanamanianParaguayanPennsylvania GermanPeruvianPimaPolishPortuguesePotawatomiPuebloPuerto RicanPuget Sound SalishRomanianRussianSalvadoranSamoanScandinavianScotch-IrishScottishSeminoleSenegaleseSerbianShoshoneSierra LeoneanSiouxSlavicSlovakSloveneSomaliSouth AfricanSouth AmericanSouth American IndianSoviet UnionSpaniardSpanishSpanish AmericanSpanish American IndianSri LankanSubsaharan AfricanSudaneseSwedishSwissSyrianTaiwaneseThaiTlingit-HaidaTohono O'OdhamTonganTrinidadian and TobagonianTsimshianTurkishU.S. Virgin IslanderUgandanUkrainianUruguayanUteVenezuelanVietnameseWelshWest IndianYakamaYaquiYugoslavianYumanYup'ikZimbabwean
Immigration
NonimmigrantsImmigrantsAfghanistanAfricaAlbaniaArgentinaArmeniaAsiaAustraliaAustriaBahamasBangladeshBarbadosBelarusBelgiumBelizeBoliviaBosnia and HerzegovinaBrazilBulgariaBurma/MyanmarCabo VerdeCambodiaCameroonCanadaCaribbeanCentral AmericaChileChinaColombiaCongoCosta RicaCroatiaCubaCzechoslovakiaDenmarkDominicaDominican RepublicEastern AfricaEastern AsiaEastern EuropeEcuadorEgyptEl SalvadorEnglandEritreaEthiopiaEuropeFijiFranceGermanyGhanaGreeceGrenadaGuatemalaGuyanaHaitiHondurasHong KongHungaryIndiaIndonesiaIranIraqIrelandItalyJamaicaJapanJordanKazakhstanKenyaKoreaKuwaitLaosLatin AmericaLatviaLebanonLiberiaLithuaniaMalaysiaMexicoMicronesiaMiddle AfricaMoldovaMoroccoNepalNetherlandsNicaraguaNigeriaNorth AmericaNorth MacedoniaNorthern AfricaNorthern EuropeNorwayOceaniaPakistanPanamaPeruPhilippinesPolandPortugalRomaniaRussiaSaudi ArabiaScotlandSenegalSerbiaSierra LeoneSingaporeSomaliaSouth AfricaSouth AmericaSouth Central AsiaSouth Eastern AsiaSouthern EuropeSpainSri LankaSt. Vincent and the GrenadinesSudanSwedenSwitzerlandSyriaTaiwanThailandTrinidad and TobagoTurkeyUgandaUkraineUruguayUzbekistanVenezuelaVietnamWest IndiesWestern AfricaWestern AsiaWestern EuropeYemenZaireZimbabweAzores
Immigrants from Israel
Race
Ancestry
AfghanAfricanAlaska NativeAlaskan AthabascanAlbanianAleutAlsatianAmericanApacheArabArapahoArgentineanArmenianAssyrian/Chaldean/SyriacAustralianAustrianBahamianBangladeshiBarbadianBasqueBelgianBelizeanBermudanBhutaneseBlackfeetBolivianBrazilianBritishBritish West IndianBulgarianBurmeseCajunCambodianCanadianCape VerdeanCarpatho RusynCelticCentral AmericanCentral American IndianCherokeeCheyenneChickasawChileanChineseChippewaChoctawColombianColvilleComancheCosta RicanCreeCreekCroatianCrowCubanCypriotCzechCzechoslovakianDanishDelawareDominicanDutchDutch West IndianEastern EuropeanEcuadorianEgyptianEnglishEstonianEthiopianEuropeanFijianFilipinoFinnishFrenchFrench American IndianFrench CanadianGermanGerman RussianGhanaianGreekGuamanian/ChamorroGuatemalanGuyaneseHaitianHmongHonduranHopiHoumaHungarianIcelanderIndian (Asian)IndonesianInupiatIranianIraqiIrishIroquoisIsraeliItalianJamaicanJapaneseJordanianKenyanKiowaKoreanLaotianLatvianLebaneseLiberianLithuanianLumbeeLuxembourgerMacedonianMalaysianMalteseMarshalleseMenomineeMexicanMongolianMoroccanNative HawaiianNavajoNepaleseNew ZealanderNicaraguanNigerianNorthern EuropeanNorwegianOkinawanOsageOttawaPaiutePakistaniPalestinianPanamanianParaguayanPennsylvania GermanPeruvianPimaPolishPortuguesePotawatomiPuebloPuerto RicanPuget Sound SalishRomanianRussianSalvadoranSamoanScandinavianScotch-IrishScottishSeminoleSenegaleseSerbianShoshoneSierra LeoneanSiouxSlavicSlovakSloveneSomaliSouth AfricanSouth AmericanSouth American IndianSoviet UnionSpaniardSpanishSpanish AmericanSpanish American IndianSri LankanSubsaharan AfricanSudaneseSwedishSwissSyrianTaiwaneseThaiTlingit-HaidaTohono O'OdhamTonganTrinidadian and TobagonianTsimshianTurkishU.S. Virgin IslanderUgandanUkrainianUruguayanUteVenezuelanVietnameseWelshWest IndianYakamaYaquiYugoslavianYumanYup'ikZimbabwean
Immigration
NonimmigrantsImmigrantsAfghanistanAfricaAlbaniaArgentinaArmeniaAsiaAustraliaAustriaBahamasBangladeshBarbadosBelarusBelgiumBelizeBoliviaBosnia and HerzegovinaBrazilBulgariaBurma/MyanmarCabo VerdeCambodiaCameroonCanadaCaribbeanCentral AmericaChileChinaColombiaCongoCosta RicaCroatiaCubaCzechoslovakiaDenmarkDominicaDominican RepublicEastern AfricaEastern AsiaEastern EuropeEcuadorEgyptEl SalvadorEnglandEritreaEthiopiaEuropeFijiFranceGermanyGhanaGreeceGrenadaGuatemalaGuyanaHaitiHondurasHong KongHungaryIndiaIndonesiaIranIraqIrelandIsraelItalyJamaicaJapanJordanKazakhstanKenyaKoreaKuwaitLaosLatin AmericaLatviaLebanonLiberiaLithuaniaMalaysiaMexicoMicronesiaMiddle AfricaMoldovaMoroccoNepalNetherlandsNicaraguaNigeriaNorth AmericaNorth MacedoniaNorthern AfricaNorthern EuropeNorwayOceaniaPakistanPanamaPeruPhilippinesPolandPortugalRomaniaRussiaSaudi ArabiaScotlandSenegalSerbiaSierra LeoneSingaporeSomaliaSouth AfricaSouth AmericaSouth Central AsiaSouth Eastern AsiaSouthern EuropeSpainSri LankaSt. Vincent and the GrenadinesSudanSwedenSwitzerlandSyriaTaiwanThailandTrinidad and TobagoTurkeyUgandaUkraineUruguayUzbekistanVenezuelaVietnamWest IndiesWestern AfricaWestern AsiaWestern EuropeYemenZaireZimbabweAzores
Householder Income Ages 25 - 44 years
Income
Poverty
Unemployment
Labor Participation
Family Structure
Vehicle Availability
Education Level
Disability

Householder Income Ages 25 - 44 years Comparison

Mexican American Indians

Immigrants from Israel

Tragic
Exceptional
$85,066
HOUSEHOLDER INCOME AGES 25 - 44 YEARS
0.5/ 100
METRIC RATING
257th/ 347
METRIC RANK
$117,219
HOUSEHOLDER INCOME AGES 25 - 44 YEARS
100.0/ 100
METRIC RATING
14th/ 347
METRIC RANK

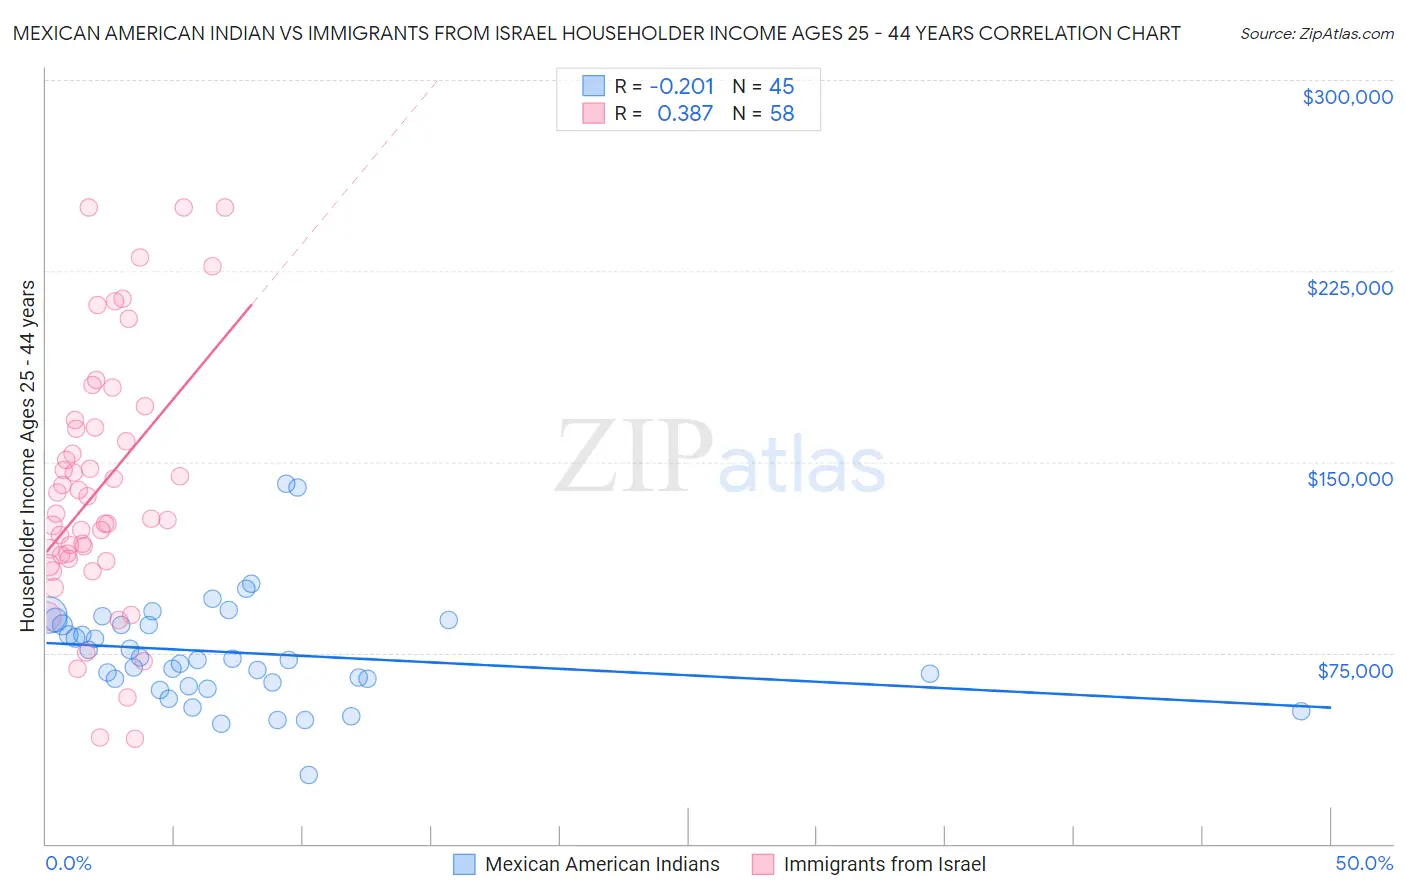
Mexican American Indian vs Immigrants from Israel Householder Income Ages 25 - 44 years Correlation Chart

The statistical analysis conducted on geographies consisting of 317,167,335 people shows a weak negative correlation between the proportion of Mexican American Indians and household income with householder between the ages 25 and 44 in the United States with a correlation coefficient (R) of -0.201 and weighted average of $85,066. Similarly, the statistical analysis conducted on geographies consisting of 209,652,410 people shows a mild positive correlation between the proportion of Immigrants from Israel and household income with householder between the ages 25 and 44 in the United States with a correlation coefficient (R) of 0.387 and weighted average of $117,219, a difference of 37.8%.
Mexican American Indian vs Immigrants from Israel Householder Income Ages 25 - 44 years

Householder Income Ages 25 - 44 years Correlation Summary

MeasurementMexican American IndianImmigrants from Israel
Minimum$27,125$41,167
Maximum$141,536$250,001
Range$114,411$208,834
Mean$75,117$139,627
Median$72,064$128,756
Interquartile 25% (IQ1)$62,611$112,036
Interquartile 75% (IQ3)$86,929$163,605
Interquartile Range (IQR)$24,319$51,569
Standard Deviation (Sample)$21,361$49,677
Standard Deviation (Population)$21,122$49,247

Similar Demographics by Householder Income Ages 25 - 44 years

Demographics Similar to Mexican American Indians by Householder Income Ages 25 - 44 years

In terms of householder income ages 25 - 44 years, the demographic groups most similar to Mexican American Indians are Central American ($85,144, a difference of 0.090%), German Russian ($85,220, a difference of 0.18%), Immigrants from Nicaragua ($84,914, a difference of 0.18%), Immigrants from Senegal ($84,848, a difference of 0.26%), and American ($84,791, a difference of 0.32%).
DemographicsRating | RankHouseholder Income Ages 25 - 44 years
Pennsylvania Germans
0.8
/100
|
#250
Tragic
$85,836
Cape Verdeans
0.8
/100
|
#251
Tragic
$85,758
Immigrants | Western Africa
0.7
/100
|
#252
Tragic
$85,676
British West Indians
0.7
/100
|
#253
Tragic
$85,565
Immigrants | Laos
0.7
/100
|
#254
Tragic
$85,553
German Russians
0.6
/100
|
#255
Tragic
$85,220
Central Americans
0.5
/100
|
#256
Tragic
$85,144
Mexican American Indians
0.5
/100
|
#257
Tragic
$85,066
Immigrants | Nicaragua
0.5
/100
|
#258
Tragic
$84,914
Immigrants | Senegal
0.5
/100
|
#259
Tragic
$84,848
Americans
0.4
/100
|
#260
Tragic
$84,791
Inupiat
0.4
/100
|
#261
Tragic
$84,619
Cree
0.4
/100
|
#262
Tragic
$84,574
Belizeans
0.4
/100
|
#263
Tragic
$84,534
Osage
0.4
/100
|
#264
Tragic
$84,461

Demographics Similar to Immigrants from Israel by Householder Income Ages 25 - 44 years

In terms of householder income ages 25 - 44 years, the demographic groups most similar to Immigrants from Israel are Immigrants from South Central Asia ($116,626, a difference of 0.51%), Immigrants from Eastern Asia ($118,056, a difference of 0.71%), Cypriot ($116,364, a difference of 0.73%), Immigrants from Australia ($115,947, a difference of 1.1%), and Immigrants from Iran ($119,204, a difference of 1.7%).
DemographicsRating | RankHouseholder Income Ages 25 - 44 years
Immigrants | Ireland
100.0
/100
|
#7
Exceptional
$120,333
Iranians
100.0
/100
|
#8
Exceptional
$120,292
Immigrants | China
100.0
/100
|
#9
Exceptional
$119,756
Indians (Asian)
100.0
/100
|
#10
Exceptional
$119,496
Okinawans
100.0
/100
|
#11
Exceptional
$119,349
Immigrants | Iran
100.0
/100
|
#12
Exceptional
$119,204
Immigrants | Eastern Asia
100.0
/100
|
#13
Exceptional
$118,056
Immigrants | Israel
100.0
/100
|
#14
Exceptional
$117,219
Immigrants | South Central Asia
100.0
/100
|
#15
Exceptional
$116,626
Cypriots
100.0
/100
|
#16
Exceptional
$116,364
Immigrants | Australia
100.0
/100
|
#17
Exceptional
$115,947
Eastern Europeans
100.0
/100
|
#18
Exceptional
$114,523
Burmese
100.0
/100
|
#19
Exceptional
$113,701
Immigrants | Korea
100.0
/100
|
#20
Exceptional
$113,401
Asians
100.0
/100
|
#21
Exceptional
$112,666