Immigrants from Czechoslovakia vs Immigrants from Senegal Householder Income Ages 25 - 44 years
COMPARE
Immigrants from Czechoslovakia
Immigrants from Senegal
Householder Income Ages 25 - 44 years
Householder Income Ages 25 - 44 years Comparison
Immigrants from Czechoslovakia
Immigrants from Senegal
$106,888
HOUSEHOLDER INCOME AGES 25 - 44 YEARS
99.9/ 100
METRIC RATING
51st/ 347
METRIC RANK
$84,848
HOUSEHOLDER INCOME AGES 25 - 44 YEARS
0.5/ 100
METRIC RATING
259th/ 347
METRIC RANK
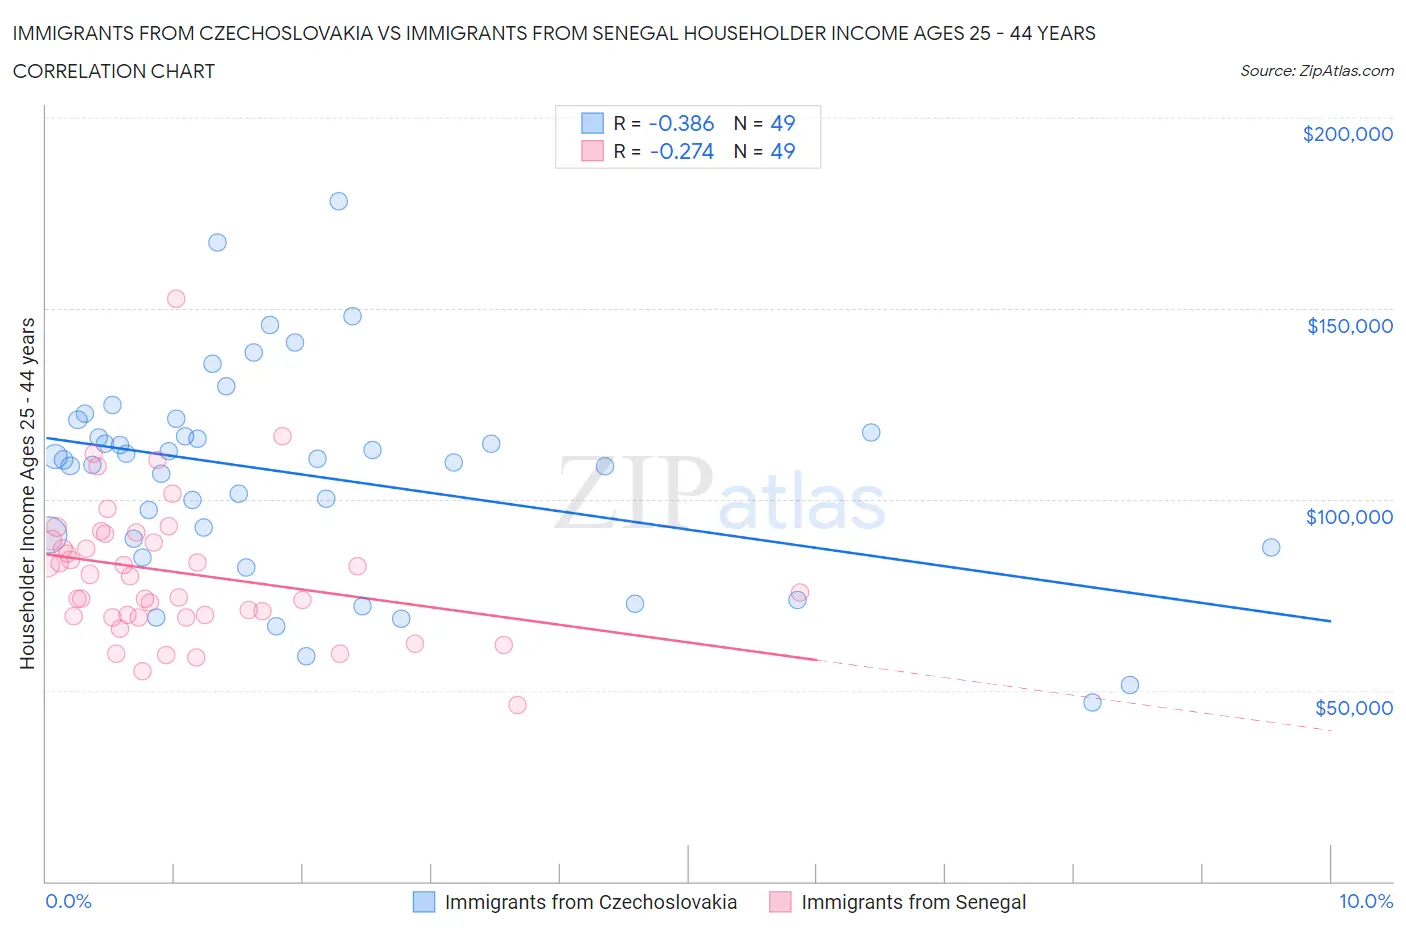
Immigrants from Czechoslovakia vs Immigrants from Senegal Householder Income Ages 25 - 44 years Correlation Chart
The statistical analysis conducted on geographies consisting of 195,143,251 people shows a mild negative correlation between the proportion of Immigrants from Czechoslovakia and household income with householder between the ages 25 and 44 in the United States with a correlation coefficient (R) of -0.386 and weighted average of $106,888. Similarly, the statistical analysis conducted on geographies consisting of 90,092,145 people shows a weak negative correlation between the proportion of Immigrants from Senegal and household income with householder between the ages 25 and 44 in the United States with a correlation coefficient (R) of -0.274 and weighted average of $84,848, a difference of 26.0%.
Householder Income Ages 25 - 44 years Correlation Summary
| Measurement | Immigrants from Czechoslovakia | Immigrants from Senegal |
| Minimum | $46,875 | $46,250 |
| Maximum | $178,200 | $152,414 |
| Range | $131,325 | $106,164 |
| Mean | $106,163 | $80,830 |
| Median | $110,384 | $80,031 |
| Interquartile 25% (IQ1) | $88,476 | $69,279 |
| Interquartile 75% (IQ3) | $119,204 | $90,145 |
| Interquartile Range (IQR) | $30,729 | $20,867 |
| Standard Deviation (Sample) | $27,581 | $18,573 |
| Standard Deviation (Population) | $27,298 | $18,383 |
Similar Demographics by Householder Income Ages 25 - 44 years
Demographics Similar to Immigrants from Czechoslovakia by Householder Income Ages 25 - 44 years
In terms of householder income ages 25 - 44 years, the demographic groups most similar to Immigrants from Czechoslovakia are Immigrants from Europe ($106,817, a difference of 0.070%), Cambodian ($107,148, a difference of 0.24%), Immigrants from Norway ($106,629, a difference of 0.24%), Paraguayan ($106,615, a difference of 0.26%), and Bulgarian ($107,264, a difference of 0.35%).
| Demographics | Rating | Rank | Householder Income Ages 25 - 44 years |
| Immigrants | Indonesia | 99.9 /100 | #44 | Exceptional $107,627 |
| Israelis | 99.9 /100 | #45 | Exceptional $107,579 |
| Immigrants | Belarus | 99.9 /100 | #46 | Exceptional $107,393 |
| Estonians | 99.9 /100 | #47 | Exceptional $107,269 |
| Bulgarians | 99.9 /100 | #48 | Exceptional $107,264 |
| Immigrants | Turkey | 99.9 /100 | #49 | Exceptional $107,258 |
| Cambodians | 99.9 /100 | #50 | Exceptional $107,148 |
| Immigrants | Czechoslovakia | 99.9 /100 | #51 | Exceptional $106,888 |
| Immigrants | Europe | 99.9 /100 | #52 | Exceptional $106,817 |
| Immigrants | Norway | 99.9 /100 | #53 | Exceptional $106,629 |
| Paraguayans | 99.9 /100 | #54 | Exceptional $106,615 |
| Greeks | 99.9 /100 | #55 | Exceptional $106,457 |
| Immigrants | Pakistan | 99.8 /100 | #56 | Exceptional $106,129 |
| Immigrants | Austria | 99.8 /100 | #57 | Exceptional $106,103 |
| Immigrants | South Africa | 99.8 /100 | #58 | Exceptional $105,748 |
Demographics Similar to Immigrants from Senegal by Householder Income Ages 25 - 44 years
In terms of householder income ages 25 - 44 years, the demographic groups most similar to Immigrants from Senegal are American ($84,791, a difference of 0.070%), Immigrants from Nicaragua ($84,914, a difference of 0.080%), Mexican American Indian ($85,066, a difference of 0.26%), Inupiat ($84,619, a difference of 0.27%), and Cree ($84,574, a difference of 0.32%).
| Demographics | Rating | Rank | Householder Income Ages 25 - 44 years |
| Immigrants | Western Africa | 0.7 /100 | #252 | Tragic $85,676 |
| British West Indians | 0.7 /100 | #253 | Tragic $85,565 |
| Immigrants | Laos | 0.7 /100 | #254 | Tragic $85,553 |
| German Russians | 0.6 /100 | #255 | Tragic $85,220 |
| Central Americans | 0.5 /100 | #256 | Tragic $85,144 |
| Mexican American Indians | 0.5 /100 | #257 | Tragic $85,066 |
| Immigrants | Nicaragua | 0.5 /100 | #258 | Tragic $84,914 |
| Immigrants | Senegal | 0.5 /100 | #259 | Tragic $84,848 |
| Americans | 0.4 /100 | #260 | Tragic $84,791 |
| Inupiat | 0.4 /100 | #261 | Tragic $84,619 |
| Cree | 0.4 /100 | #262 | Tragic $84,574 |
| Belizeans | 0.4 /100 | #263 | Tragic $84,534 |
| Osage | 0.4 /100 | #264 | Tragic $84,461 |
| Sudanese | 0.4 /100 | #265 | Tragic $84,401 |
| Immigrants | Cabo Verde | 0.3 /100 | #266 | Tragic $84,304 |