Irish vs Immigrants from Senegal Householder Income Ages 25 - 44 years
COMPARE
Irish
Immigrants from Senegal
Householder Income Ages 25 - 44 years
Householder Income Ages 25 - 44 years Comparison
Irish
Immigrants from Senegal
$96,730
HOUSEHOLDER INCOME AGES 25 - 44 YEARS
76.9/ 100
METRIC RATING
148th/ 347
METRIC RANK
$84,848
HOUSEHOLDER INCOME AGES 25 - 44 YEARS
0.5/ 100
METRIC RATING
259th/ 347
METRIC RANK
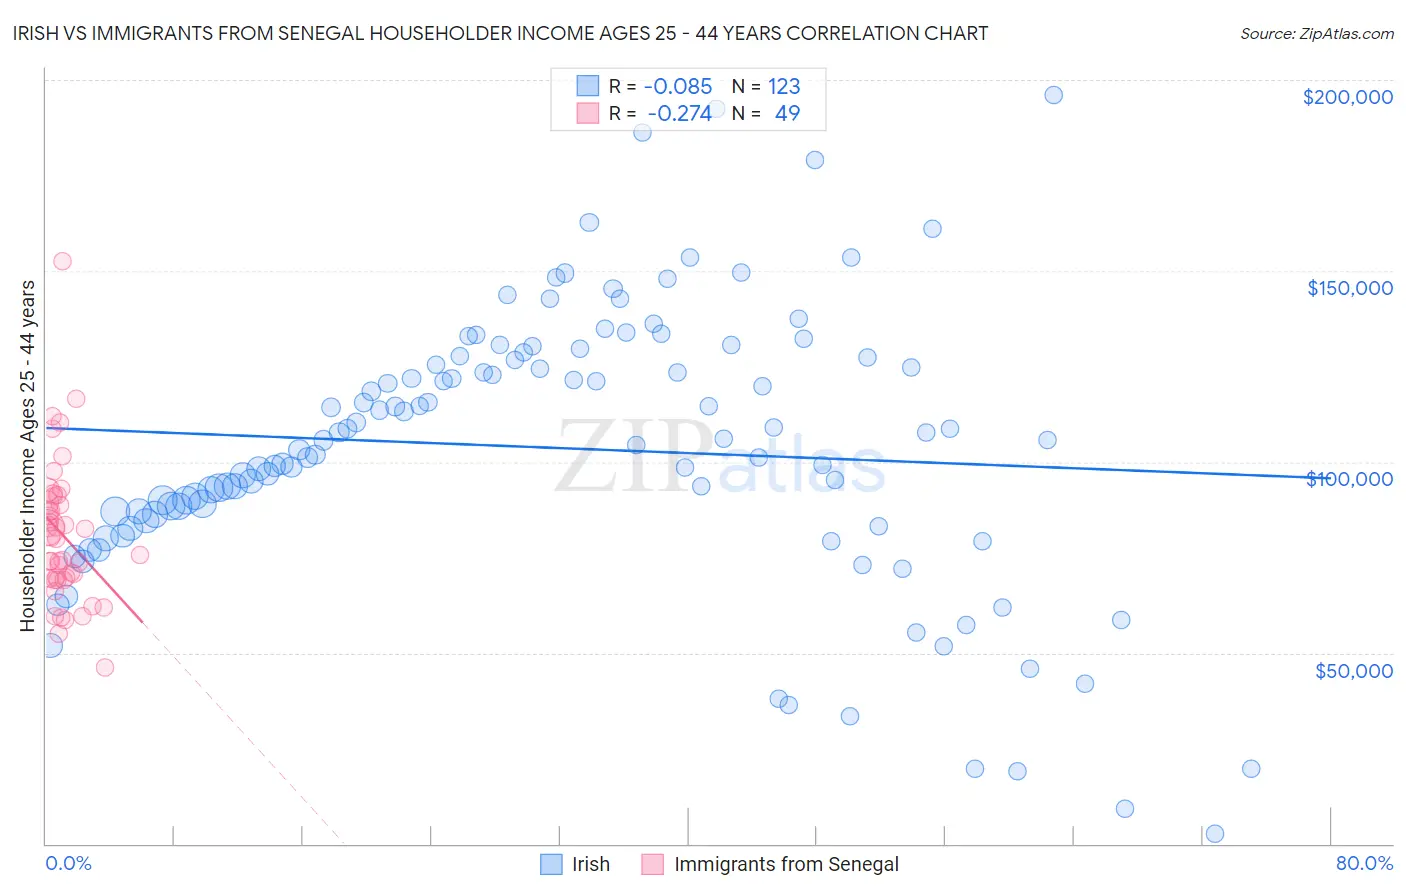
Irish vs Immigrants from Senegal Householder Income Ages 25 - 44 years Correlation Chart
The statistical analysis conducted on geographies consisting of 572,831,094 people shows a slight negative correlation between the proportion of Irish and household income with householder between the ages 25 and 44 in the United States with a correlation coefficient (R) of -0.085 and weighted average of $96,730. Similarly, the statistical analysis conducted on geographies consisting of 90,092,145 people shows a weak negative correlation between the proportion of Immigrants from Senegal and household income with householder between the ages 25 and 44 in the United States with a correlation coefficient (R) of -0.274 and weighted average of $84,848, a difference of 14.0%.
Householder Income Ages 25 - 44 years Correlation Summary
| Measurement | Irish | Immigrants from Senegal |
| Minimum | $2,499 | $46,250 |
| Maximum | $195,924 | $152,414 |
| Range | $193,425 | $106,164 |
| Mean | $103,698 | $80,830 |
| Median | $105,634 | $80,031 |
| Interquartile 25% (IQ1) | $84,609 | $69,279 |
| Interquartile 75% (IQ3) | $127,232 | $90,145 |
| Interquartile Range (IQR) | $42,623 | $20,867 |
| Standard Deviation (Sample) | $36,620 | $18,573 |
| Standard Deviation (Population) | $36,470 | $18,383 |
Similar Demographics by Householder Income Ages 25 - 44 years
Demographics Similar to Irish by Householder Income Ages 25 - 44 years
In terms of householder income ages 25 - 44 years, the demographic groups most similar to Irish are Basque ($96,709, a difference of 0.020%), Immigrants from Syria ($96,789, a difference of 0.060%), Ugandan ($96,667, a difference of 0.070%), Ethiopian ($96,824, a difference of 0.10%), and Norwegian ($96,866, a difference of 0.14%).
| Demographics | Rating | Rank | Householder Income Ages 25 - 44 years |
| Luxembourgers | 81.5 /100 | #141 | Excellent $97,237 |
| Danes | 81.3 /100 | #142 | Excellent $97,221 |
| Immigrants | Jordan | 81.0 /100 | #143 | Excellent $97,185 |
| Immigrants | Chile | 80.8 /100 | #144 | Excellent $97,159 |
| Norwegians | 78.2 /100 | #145 | Good $96,866 |
| Ethiopians | 77.8 /100 | #146 | Good $96,824 |
| Immigrants | Syria | 77.4 /100 | #147 | Good $96,789 |
| Irish | 76.9 /100 | #148 | Good $96,730 |
| Basques | 76.6 /100 | #149 | Good $96,709 |
| Ugandans | 76.2 /100 | #150 | Good $96,667 |
| Czechs | 74.8 /100 | #151 | Good $96,525 |
| South American Indians | 74.5 /100 | #152 | Good $96,497 |
| Slovenes | 73.9 /100 | #153 | Good $96,439 |
| Slavs | 73.2 /100 | #154 | Good $96,377 |
| Moroccans | 70.3 /100 | #155 | Good $96,117 |
Demographics Similar to Immigrants from Senegal by Householder Income Ages 25 - 44 years
In terms of householder income ages 25 - 44 years, the demographic groups most similar to Immigrants from Senegal are American ($84,791, a difference of 0.070%), Immigrants from Nicaragua ($84,914, a difference of 0.080%), Mexican American Indian ($85,066, a difference of 0.26%), Inupiat ($84,619, a difference of 0.27%), and Cree ($84,574, a difference of 0.32%).
| Demographics | Rating | Rank | Householder Income Ages 25 - 44 years |
| Immigrants | Western Africa | 0.7 /100 | #252 | Tragic $85,676 |
| British West Indians | 0.7 /100 | #253 | Tragic $85,565 |
| Immigrants | Laos | 0.7 /100 | #254 | Tragic $85,553 |
| German Russians | 0.6 /100 | #255 | Tragic $85,220 |
| Central Americans | 0.5 /100 | #256 | Tragic $85,144 |
| Mexican American Indians | 0.5 /100 | #257 | Tragic $85,066 |
| Immigrants | Nicaragua | 0.5 /100 | #258 | Tragic $84,914 |
| Immigrants | Senegal | 0.5 /100 | #259 | Tragic $84,848 |
| Americans | 0.4 /100 | #260 | Tragic $84,791 |
| Inupiat | 0.4 /100 | #261 | Tragic $84,619 |
| Cree | 0.4 /100 | #262 | Tragic $84,574 |
| Belizeans | 0.4 /100 | #263 | Tragic $84,534 |
| Osage | 0.4 /100 | #264 | Tragic $84,461 |
| Sudanese | 0.4 /100 | #265 | Tragic $84,401 |
| Immigrants | Cabo Verde | 0.3 /100 | #266 | Tragic $84,304 |