Menominee vs Immigrants from Africa Wage/Income Gap
COMPARE
Menominee
Immigrants from Africa
Wage/Income Gap
Wage/Income Gap Comparison
Menominee
Immigrants from Africa
22.7%
WAGE/INCOME GAP
99.9/ 100
METRIC RATING
67th/ 347
METRIC RANK
23.2%
WAGE/INCOME GAP
99.8/ 100
METRIC RATING
83rd/ 347
METRIC RANK
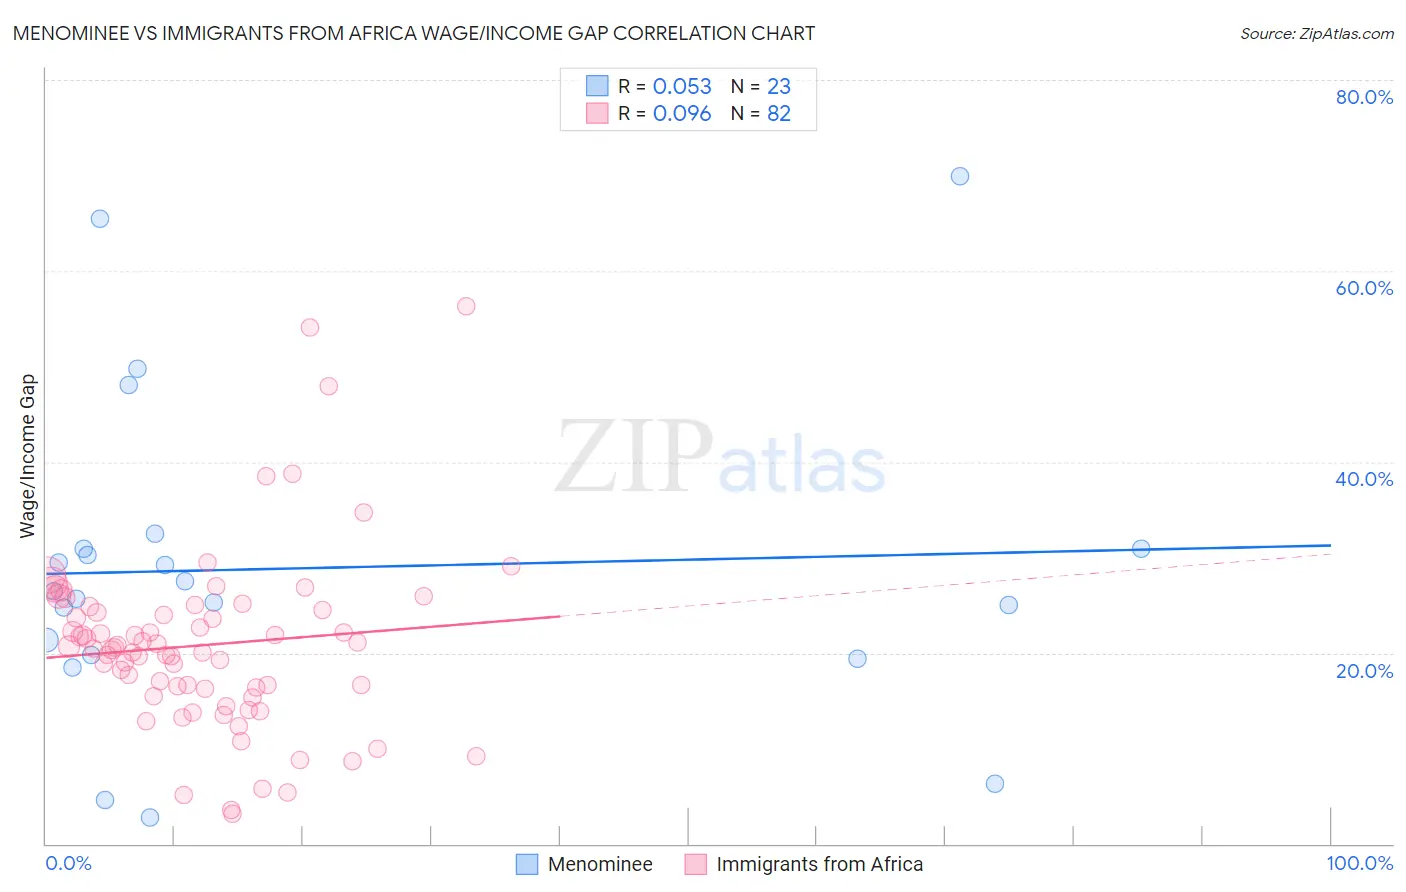
Menominee vs Immigrants from Africa Wage/Income Gap Correlation Chart
The statistical analysis conducted on geographies consisting of 45,771,803 people shows a slight positive correlation between the proportion of Menominee and wage/income gap percentage in the United States with a correlation coefficient (R) of 0.053 and weighted average of 22.7%. Similarly, the statistical analysis conducted on geographies consisting of 468,950,704 people shows a slight positive correlation between the proportion of Immigrants from Africa and wage/income gap percentage in the United States with a correlation coefficient (R) of 0.096 and weighted average of 23.2%, a difference of 2.0%.
Wage/Income Gap Correlation Summary
| Measurement | Menominee | Immigrants from Africa |
| Minimum | 2.8% | 3.2% |
| Maximum | 70.0% | 56.4% |
| Range | 67.2% | 53.2% |
| Mean | 28.9% | 20.8% |
| Median | 26.5% | 20.5% |
| Interquartile 25% (IQ1) | 19.7% | 16.3% |
| Interquartile 75% (IQ3) | 30.9% | 24.5% |
| Interquartile Range (IQR) | 11.2% | 8.2% |
| Standard Deviation (Sample) | 16.6% | 9.4% |
| Standard Deviation (Population) | 16.2% | 9.3% |
Demographics Similar to Menominee and Immigrants from Africa by Wage/Income Gap
In terms of wage/income gap, the demographic groups most similar to Menominee are Immigrants from Nigeria (22.7%, a difference of 0.0%), Indonesian (22.7%, a difference of 0.040%), Immigrants from Uzbekistan (22.7%, a difference of 0.15%), Central American Indian (22.7%, a difference of 0.17%), and Immigrants from El Salvador (22.8%, a difference of 0.31%). Similarly, the demographic groups most similar to Immigrants from Africa are Bermudan (23.1%, a difference of 0.29%), Central American (23.1%, a difference of 0.29%), Cuban (23.3%, a difference of 0.37%), Immigrants from Cambodia (23.3%, a difference of 0.43%), and Salvadoran (23.0%, a difference of 0.76%).
| Demographics | Rating | Rank | Wage/Income Gap |
| Guatemalans | 99.9 /100 | #65 | Exceptional 22.6% |
| Central American Indians | 99.9 /100 | #66 | Exceptional 22.7% |
| Menominee | 99.9 /100 | #67 | Exceptional 22.7% |
| Immigrants | Nigeria | 99.9 /100 | #68 | Exceptional 22.7% |
| Indonesians | 99.9 /100 | #69 | Exceptional 22.7% |
| Immigrants | Uzbekistan | 99.9 /100 | #70 | Exceptional 22.7% |
| Immigrants | El Salvador | 99.9 /100 | #71 | Exceptional 22.8% |
| Sub-Saharan Africans | 99.9 /100 | #72 | Exceptional 22.8% |
| Immigrants | Eastern Africa | 99.9 /100 | #73 | Exceptional 22.8% |
| Immigrants | Burma/Myanmar | 99.9 /100 | #74 | Exceptional 22.8% |
| Fijians | 99.9 /100 | #75 | Exceptional 22.9% |
| Ecuadorians | 99.9 /100 | #76 | Exceptional 22.9% |
| Africans | 99.9 /100 | #77 | Exceptional 22.9% |
| Nigerians | 99.9 /100 | #78 | Exceptional 23.0% |
| Immigrants | Nicaragua | 99.9 /100 | #79 | Exceptional 23.0% |
| Salvadorans | 99.9 /100 | #80 | Exceptional 23.0% |
| Bermudans | 99.8 /100 | #81 | Exceptional 23.1% |
| Central Americans | 99.8 /100 | #82 | Exceptional 23.1% |
| Immigrants | Africa | 99.8 /100 | #83 | Exceptional 23.2% |
| Cubans | 99.7 /100 | #84 | Exceptional 23.3% |
| Immigrants | Cambodia | 99.7 /100 | #85 | Exceptional 23.3% |