Menominee vs Immigrants from Uzbekistan Wage/Income Gap
COMPARE
Menominee
Immigrants from Uzbekistan
Wage/Income Gap
Wage/Income Gap Comparison
Menominee
Immigrants from Uzbekistan
22.7%
WAGE/INCOME GAP
99.9/ 100
METRIC RATING
67th/ 347
METRIC RANK
22.7%
WAGE/INCOME GAP
99.9/ 100
METRIC RATING
70th/ 347
METRIC RANK
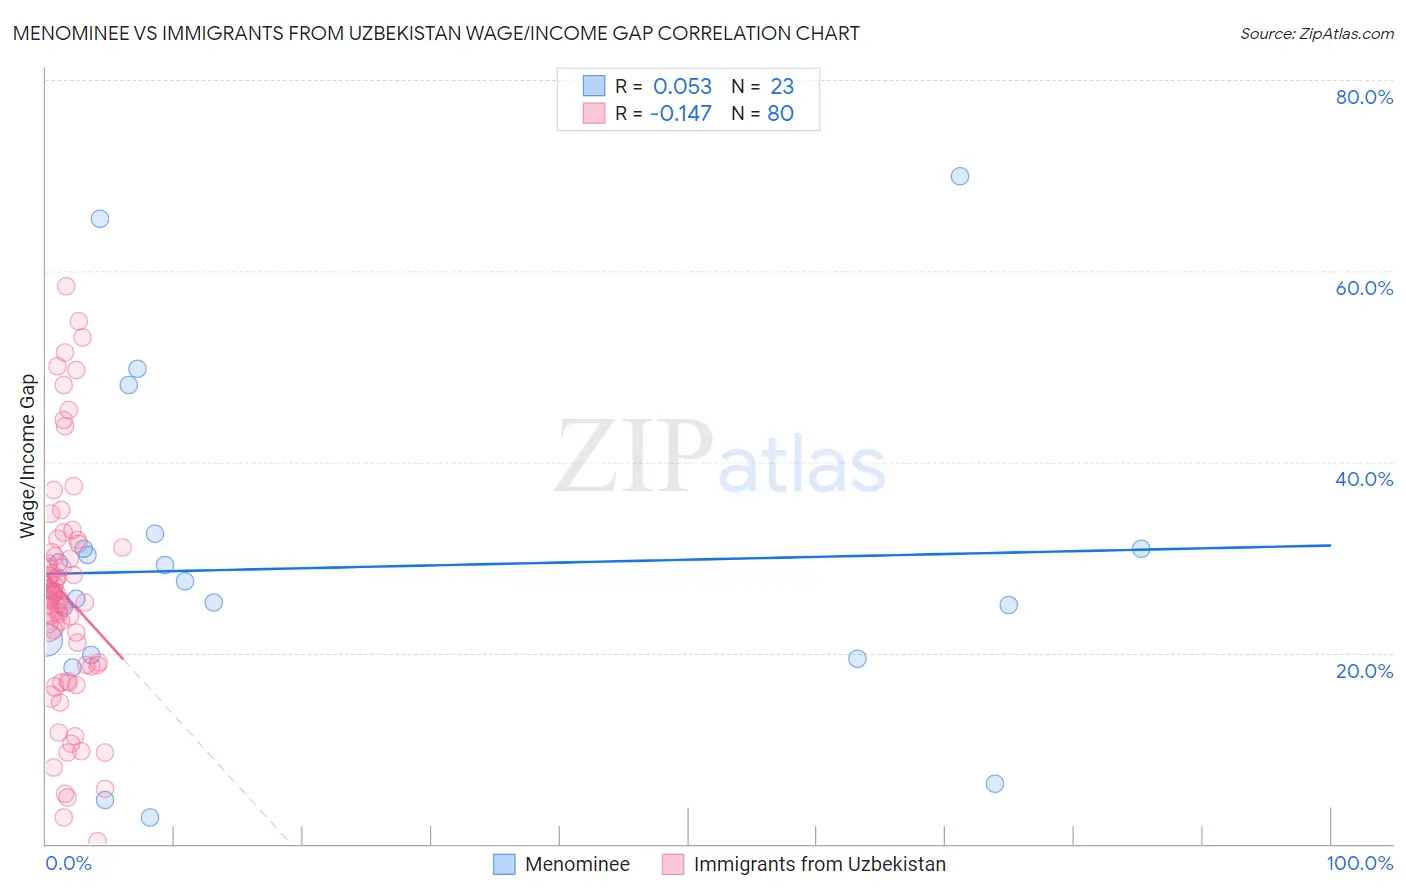
Menominee vs Immigrants from Uzbekistan Wage/Income Gap Correlation Chart
The statistical analysis conducted on geographies consisting of 45,771,803 people shows a slight positive correlation between the proportion of Menominee and wage/income gap percentage in the United States with a correlation coefficient (R) of 0.053 and weighted average of 22.7%. Similarly, the statistical analysis conducted on geographies consisting of 118,761,905 people shows a poor negative correlation between the proportion of Immigrants from Uzbekistan and wage/income gap percentage in the United States with a correlation coefficient (R) of -0.147 and weighted average of 22.7%, a difference of 0.15%.
Wage/Income Gap Correlation Summary
| Measurement | Menominee | Immigrants from Uzbekistan |
| Minimum | 2.8% | 0.26% |
| Maximum | 70.0% | 58.5% |
| Range | 67.2% | 58.2% |
| Mean | 28.9% | 26.0% |
| Median | 26.5% | 25.8% |
| Interquartile 25% (IQ1) | 19.7% | 18.6% |
| Interquartile 75% (IQ3) | 30.9% | 30.7% |
| Interquartile Range (IQR) | 11.2% | 12.1% |
| Standard Deviation (Sample) | 16.6% | 12.3% |
| Standard Deviation (Population) | 16.2% | 12.2% |
Demographics Similar to Menominee and Immigrants from Uzbekistan by Wage/Income Gap
In terms of wage/income gap, the demographic groups most similar to Menominee are Immigrants from Nigeria (22.7%, a difference of 0.0%), Indonesian (22.7%, a difference of 0.040%), Central American Indian (22.7%, a difference of 0.17%), Immigrants from El Salvador (22.8%, a difference of 0.31%), and Guatemalan (22.6%, a difference of 0.41%). Similarly, the demographic groups most similar to Immigrants from Uzbekistan are Indonesian (22.7%, a difference of 0.11%), Immigrants from Nigeria (22.7%, a difference of 0.14%), Immigrants from El Salvador (22.8%, a difference of 0.17%), Subsaharan African (22.8%, a difference of 0.31%), and Central American Indian (22.7%, a difference of 0.32%).
| Demographics | Rating | Rank | Wage/Income Gap |
| Immigrants | Cuba | 100.0 /100 | #58 | Exceptional 22.4% |
| Navajo | 100.0 /100 | #59 | Exceptional 22.4% |
| Immigrants | Middle Africa | 100.0 /100 | #60 | Exceptional 22.4% |
| Immigrants | Fiji | 100.0 /100 | #61 | Exceptional 22.4% |
| Immigrants | Guatemala | 100.0 /100 | #62 | Exceptional 22.5% |
| Immigrants | Ecuador | 100.0 /100 | #63 | Exceptional 22.5% |
| Spanish American Indians | 100.0 /100 | #64 | Exceptional 22.5% |
| Guatemalans | 99.9 /100 | #65 | Exceptional 22.6% |
| Central American Indians | 99.9 /100 | #66 | Exceptional 22.7% |
| Menominee | 99.9 /100 | #67 | Exceptional 22.7% |
| Immigrants | Nigeria | 99.9 /100 | #68 | Exceptional 22.7% |
| Indonesians | 99.9 /100 | #69 | Exceptional 22.7% |
| Immigrants | Uzbekistan | 99.9 /100 | #70 | Exceptional 22.7% |
| Immigrants | El Salvador | 99.9 /100 | #71 | Exceptional 22.8% |
| Sub-Saharan Africans | 99.9 /100 | #72 | Exceptional 22.8% |
| Immigrants | Eastern Africa | 99.9 /100 | #73 | Exceptional 22.8% |
| Immigrants | Burma/Myanmar | 99.9 /100 | #74 | Exceptional 22.8% |
| Fijians | 99.9 /100 | #75 | Exceptional 22.9% |
| Ecuadorians | 99.9 /100 | #76 | Exceptional 22.9% |
| Africans | 99.9 /100 | #77 | Exceptional 22.9% |
| Nigerians | 99.9 /100 | #78 | Exceptional 23.0% |