Menominee vs Cajun Median Female Earnings
COMPARE
Menominee
Cajun
Median Female Earnings
Median Female Earnings Comparison
Menominee
Cajuns
$33,894
MEDIAN FEMALE EARNINGS
0.0/ 100
METRIC RATING
330th/ 347
METRIC RANK
$34,034
MEDIAN FEMALE EARNINGS
0.0/ 100
METRIC RATING
327th/ 347
METRIC RANK
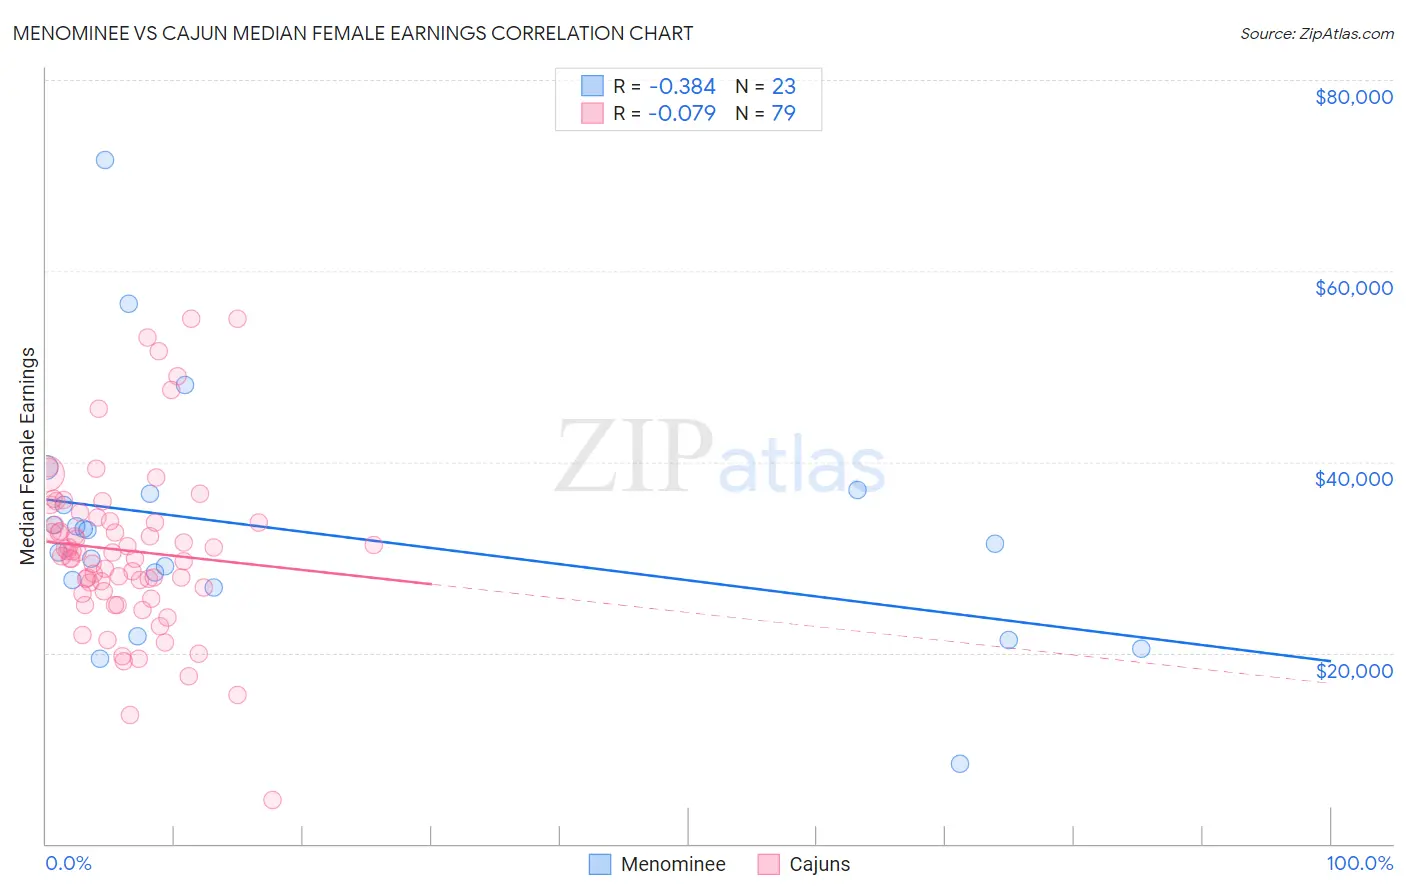
Menominee vs Cajun Median Female Earnings Correlation Chart
The statistical analysis conducted on geographies consisting of 45,775,261 people shows a mild negative correlation between the proportion of Menominee and median female earnings in the United States with a correlation coefficient (R) of -0.384 and weighted average of $33,894. Similarly, the statistical analysis conducted on geographies consisting of 149,646,456 people shows a slight negative correlation between the proportion of Cajuns and median female earnings in the United States with a correlation coefficient (R) of -0.079 and weighted average of $34,034, a difference of 0.41%.
Median Female Earnings Correlation Summary
| Measurement | Menominee | Cajun |
| Minimum | $8,333 | $4,615 |
| Maximum | $71,591 | $55,000 |
| Range | $63,258 | $50,385 |
| Mean | $32,691 | $30,723 |
| Median | $31,453 | $30,456 |
| Interquartile 25% (IQ1) | $26,780 | $26,402 |
| Interquartile 75% (IQ3) | $36,632 | $33,785 |
| Interquartile Range (IQR) | $9,852 | $7,382 |
| Standard Deviation (Sample) | $12,945 | $8,808 |
| Standard Deviation (Population) | $12,660 | $8,752 |
Demographics Similar to Menominee and Cajuns by Median Female Earnings
In terms of median female earnings, the demographic groups most similar to Menominee are Hopi ($33,932, a difference of 0.11%), Immigrants from Central America ($33,953, a difference of 0.17%), Native/Alaskan ($33,806, a difference of 0.26%), Choctaw ($33,775, a difference of 0.35%), and Kiowa ($34,074, a difference of 0.53%). Similarly, the demographic groups most similar to Cajuns are Kiowa ($34,074, a difference of 0.12%), Dutch West Indian ($34,106, a difference of 0.21%), Immigrants from Central America ($33,953, a difference of 0.24%), Hopi ($33,932, a difference of 0.30%), and Native/Alaskan ($33,806, a difference of 0.67%).
| Demographics | Rating | Rank | Median Female Earnings |
| Immigrants | Yemen | 0.0 /100 | #318 | Tragic $34,693 |
| Shoshone | 0.0 /100 | #319 | Tragic $34,677 |
| Immigrants | Honduras | 0.0 /100 | #320 | Tragic $34,647 |
| Hispanics or Latinos | 0.0 /100 | #321 | Tragic $34,421 |
| Chickasaw | 0.0 /100 | #322 | Tragic $34,414 |
| Seminole | 0.0 /100 | #323 | Tragic $34,385 |
| Immigrants | Congo | 0.0 /100 | #324 | Tragic $34,317 |
| Dutch West Indians | 0.0 /100 | #325 | Tragic $34,106 |
| Kiowa | 0.0 /100 | #326 | Tragic $34,074 |
| Cajuns | 0.0 /100 | #327 | Tragic $34,034 |
| Immigrants | Central America | 0.0 /100 | #328 | Tragic $33,953 |
| Hopi | 0.0 /100 | #329 | Tragic $33,932 |
| Menominee | 0.0 /100 | #330 | Tragic $33,894 |
| Natives/Alaskans | 0.0 /100 | #331 | Tragic $33,806 |
| Choctaw | 0.0 /100 | #332 | Tragic $33,775 |
| Mexicans | 0.0 /100 | #333 | Tragic $33,664 |
| Spanish American Indians | 0.0 /100 | #334 | Tragic $33,625 |
| Creek | 0.0 /100 | #335 | Tragic $33,437 |
| Ottawa | 0.0 /100 | #336 | Tragic $33,378 |
| Yakama | 0.0 /100 | #337 | Tragic $33,354 |
| Immigrants | Cuba | 0.0 /100 | #338 | Tragic $33,291 |