Menominee vs Greek Median Female Earnings
COMPARE
Menominee
Greek
Median Female Earnings
Median Female Earnings Comparison
Menominee
Greeks
$33,894
MEDIAN FEMALE EARNINGS
0.0/ 100
METRIC RATING
330th/ 347
METRIC RANK
$42,336
MEDIAN FEMALE EARNINGS
99.6/ 100
METRIC RATING
79th/ 347
METRIC RANK
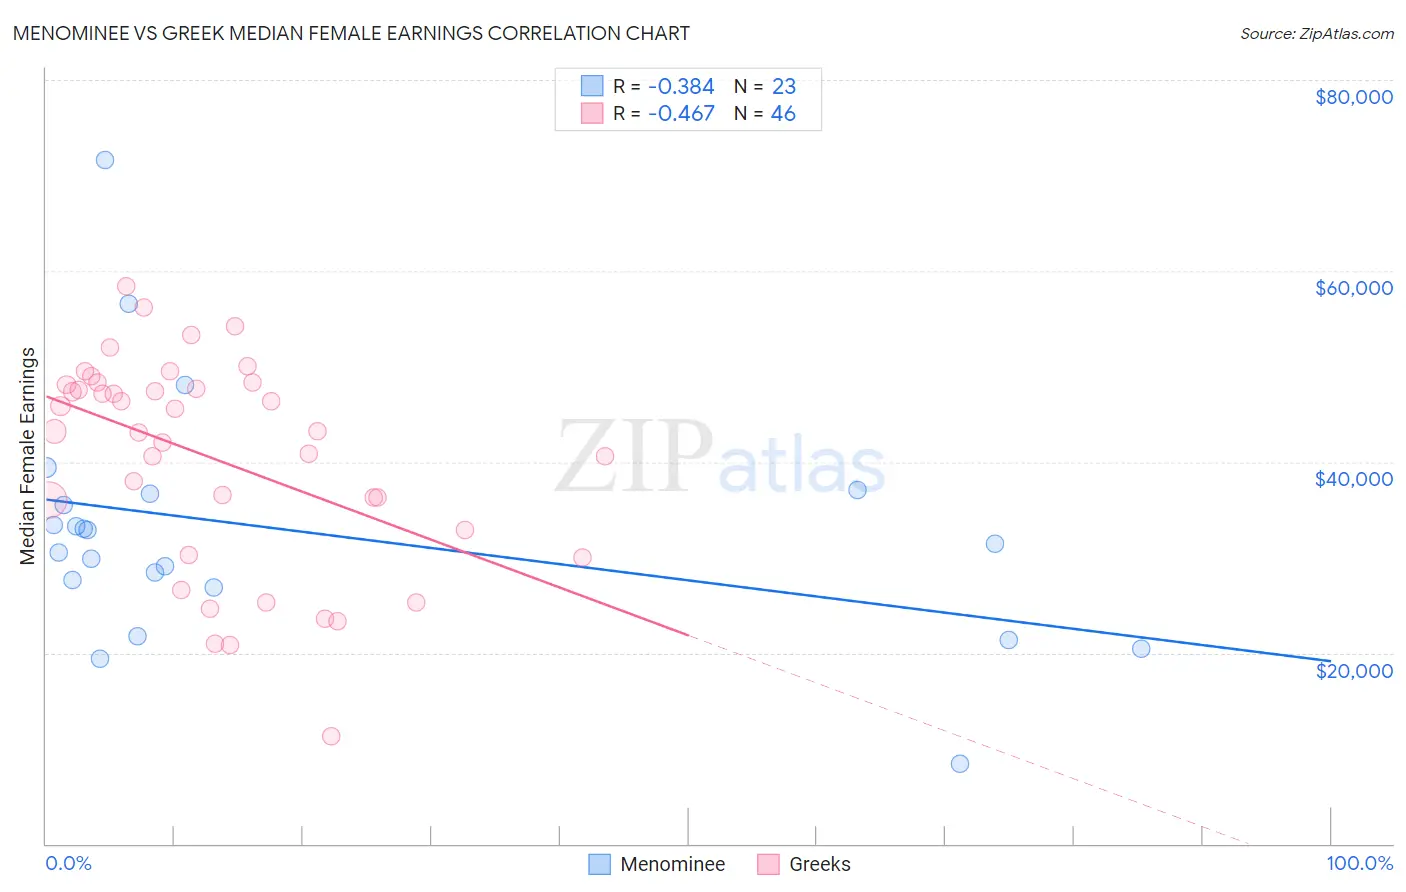
Menominee vs Greek Median Female Earnings Correlation Chart
The statistical analysis conducted on geographies consisting of 45,775,261 people shows a mild negative correlation between the proportion of Menominee and median female earnings in the United States with a correlation coefficient (R) of -0.384 and weighted average of $33,894. Similarly, the statistical analysis conducted on geographies consisting of 482,348,495 people shows a moderate negative correlation between the proportion of Greeks and median female earnings in the United States with a correlation coefficient (R) of -0.467 and weighted average of $42,336, a difference of 24.9%.
Median Female Earnings Correlation Summary
| Measurement | Menominee | Greek |
| Minimum | $8,333 | $11,250 |
| Maximum | $71,591 | $58,379 |
| Range | $63,258 | $47,129 |
| Mean | $32,691 | $40,351 |
| Median | $31,453 | $43,165 |
| Interquartile 25% (IQ1) | $26,780 | $32,889 |
| Interquartile 75% (IQ3) | $36,632 | $48,068 |
| Interquartile Range (IQR) | $9,852 | $15,179 |
| Standard Deviation (Sample) | $12,945 | $10,999 |
| Standard Deviation (Population) | $12,660 | $10,879 |
Similar Demographics by Median Female Earnings
Demographics Similar to Menominee by Median Female Earnings
In terms of median female earnings, the demographic groups most similar to Menominee are Hopi ($33,932, a difference of 0.11%), Immigrants from Central America ($33,953, a difference of 0.17%), Native/Alaskan ($33,806, a difference of 0.26%), Choctaw ($33,775, a difference of 0.35%), and Cajun ($34,034, a difference of 0.41%).
| Demographics | Rating | Rank | Median Female Earnings |
| Seminole | 0.0 /100 | #323 | Tragic $34,385 |
| Immigrants | Congo | 0.0 /100 | #324 | Tragic $34,317 |
| Dutch West Indians | 0.0 /100 | #325 | Tragic $34,106 |
| Kiowa | 0.0 /100 | #326 | Tragic $34,074 |
| Cajuns | 0.0 /100 | #327 | Tragic $34,034 |
| Immigrants | Central America | 0.0 /100 | #328 | Tragic $33,953 |
| Hopi | 0.0 /100 | #329 | Tragic $33,932 |
| Menominee | 0.0 /100 | #330 | Tragic $33,894 |
| Natives/Alaskans | 0.0 /100 | #331 | Tragic $33,806 |
| Choctaw | 0.0 /100 | #332 | Tragic $33,775 |
| Mexicans | 0.0 /100 | #333 | Tragic $33,664 |
| Spanish American Indians | 0.0 /100 | #334 | Tragic $33,625 |
| Creek | 0.0 /100 | #335 | Tragic $33,437 |
| Ottawa | 0.0 /100 | #336 | Tragic $33,378 |
| Yakama | 0.0 /100 | #337 | Tragic $33,354 |
Demographics Similar to Greeks by Median Female Earnings
In terms of median female earnings, the demographic groups most similar to Greeks are Immigrants from Moldova ($42,304, a difference of 0.080%), Immigrants from Albania ($42,388, a difference of 0.12%), Immigrants from Kazakhstan ($42,386, a difference of 0.12%), Immigrants from Southern Europe ($42,275, a difference of 0.15%), and Immigrants from Morocco ($42,229, a difference of 0.25%).
| Demographics | Rating | Rank | Median Female Earnings |
| Albanians | 99.8 /100 | #72 | Exceptional $42,584 |
| Mongolians | 99.7 /100 | #73 | Exceptional $42,542 |
| Immigrants | South Africa | 99.7 /100 | #74 | Exceptional $42,508 |
| New Zealanders | 99.7 /100 | #75 | Exceptional $42,446 |
| Immigrants | Italy | 99.7 /100 | #76 | Exceptional $42,446 |
| Immigrants | Albania | 99.6 /100 | #77 | Exceptional $42,388 |
| Immigrants | Kazakhstan | 99.6 /100 | #78 | Exceptional $42,386 |
| Greeks | 99.6 /100 | #79 | Exceptional $42,336 |
| Immigrants | Moldova | 99.6 /100 | #80 | Exceptional $42,304 |
| Immigrants | Southern Europe | 99.5 /100 | #81 | Exceptional $42,275 |
| Immigrants | Morocco | 99.5 /100 | #82 | Exceptional $42,229 |
| Immigrants | Sierra Leone | 99.5 /100 | #83 | Exceptional $42,214 |
| Armenians | 99.5 /100 | #84 | Exceptional $42,212 |
| Laotians | 99.4 /100 | #85 | Exceptional $42,133 |
| Immigrants | St. Vincent and the Grenadines | 99.3 /100 | #86 | Exceptional $42,108 |