Marshallese vs Immigrants from Liberia Median Male Earnings
COMPARE
Marshallese
Immigrants from Liberia
Median Male Earnings
Median Male Earnings Comparison
Marshallese
Immigrants from Liberia
$48,137
MEDIAN MALE EARNINGS
0.2/ 100
METRIC RATING
281st/ 347
METRIC RANK
$48,317
MEDIAN MALE EARNINGS
0.2/ 100
METRIC RATING
278th/ 347
METRIC RANK
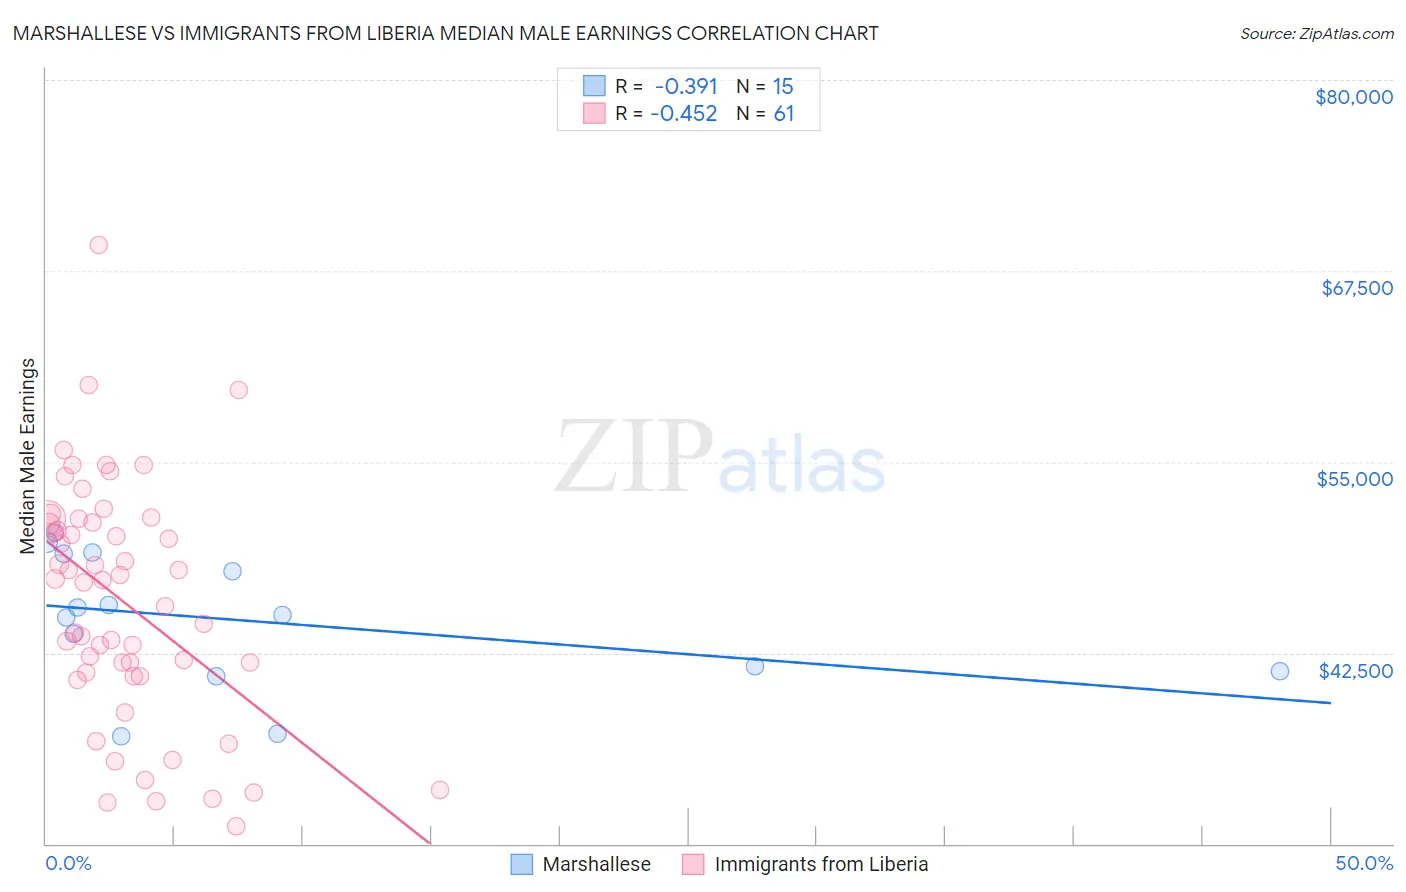
Marshallese vs Immigrants from Liberia Median Male Earnings Correlation Chart
The statistical analysis conducted on geographies consisting of 14,760,790 people shows a mild negative correlation between the proportion of Marshallese and median male earnings in the United States with a correlation coefficient (R) of -0.391 and weighted average of $48,137. Similarly, the statistical analysis conducted on geographies consisting of 135,282,382 people shows a moderate negative correlation between the proportion of Immigrants from Liberia and median male earnings in the United States with a correlation coefficient (R) of -0.452 and weighted average of $48,317, a difference of 0.37%.
Median Male Earnings Correlation Summary
| Measurement | Marshallese | Immigrants from Liberia |
| Minimum | $37,012 | $31,133 |
| Maximum | $50,395 | $69,167 |
| Range | $13,383 | $38,034 |
| Mean | $44,583 | $45,872 |
| Median | $45,000 | $47,293 |
| Interquartile 25% (IQ1) | $41,333 | $41,079 |
| Interquartile 75% (IQ3) | $48,969 | $51,125 |
| Interquartile Range (IQR) | $7,636 | $10,046 |
| Standard Deviation (Sample) | $4,286 | $7,800 |
| Standard Deviation (Population) | $4,141 | $7,735 |
Demographics Similar to Marshallese and Immigrants from Liberia by Median Male Earnings
In terms of median male earnings, the demographic groups most similar to Marshallese are Central American ($48,093, a difference of 0.090%), Comanche ($48,202, a difference of 0.13%), Immigrants from Jamaica ($48,040, a difference of 0.20%), Hmong ($48,254, a difference of 0.24%), and African ($47,994, a difference of 0.30%). Similarly, the demographic groups most similar to Immigrants from Liberia are Belizean ($48,358, a difference of 0.080%), Hmong ($48,254, a difference of 0.13%), Blackfeet ($48,402, a difference of 0.18%), Comanche ($48,202, a difference of 0.24%), and Immigrants from Somalia ($48,439, a difference of 0.25%).
| Demographics | Rating | Rank | Median Male Earnings |
| Tsimshian | 0.4 /100 | #269 | Tragic $48,836 |
| Potawatomi | 0.4 /100 | #270 | Tragic $48,768 |
| Cherokee | 0.3 /100 | #271 | Tragic $48,669 |
| Salvadorans | 0.3 /100 | #272 | Tragic $48,646 |
| Jamaicans | 0.3 /100 | #273 | Tragic $48,632 |
| Colville | 0.3 /100 | #274 | Tragic $48,516 |
| Immigrants | Somalia | 0.3 /100 | #275 | Tragic $48,439 |
| Blackfeet | 0.3 /100 | #276 | Tragic $48,402 |
| Belizeans | 0.2 /100 | #277 | Tragic $48,358 |
| Immigrants | Liberia | 0.2 /100 | #278 | Tragic $48,317 |
| Hmong | 0.2 /100 | #279 | Tragic $48,254 |
| Comanche | 0.2 /100 | #280 | Tragic $48,202 |
| Marshallese | 0.2 /100 | #281 | Tragic $48,137 |
| Central Americans | 0.2 /100 | #282 | Tragic $48,093 |
| Immigrants | Jamaica | 0.2 /100 | #283 | Tragic $48,040 |
| Africans | 0.2 /100 | #284 | Tragic $47,994 |
| Paiute | 0.2 /100 | #285 | Tragic $47,991 |
| Mexican American Indians | 0.2 /100 | #286 | Tragic $47,990 |
| Immigrants | El Salvador | 0.2 /100 | #287 | Tragic $47,973 |
| Shoshone | 0.2 /100 | #288 | Tragic $47,930 |
| Chickasaw | 0.1 /100 | #289 | Tragic $47,832 |