Spaniard vs Immigrants from Liberia Median Male Earnings
COMPARE
Spaniard
Immigrants from Liberia
Median Male Earnings
Median Male Earnings Comparison
Spaniards
Immigrants from Liberia
$54,401
MEDIAN MALE EARNINGS
47.8/ 100
METRIC RATING
176th/ 347
METRIC RANK
$48,317
MEDIAN MALE EARNINGS
0.2/ 100
METRIC RATING
278th/ 347
METRIC RANK
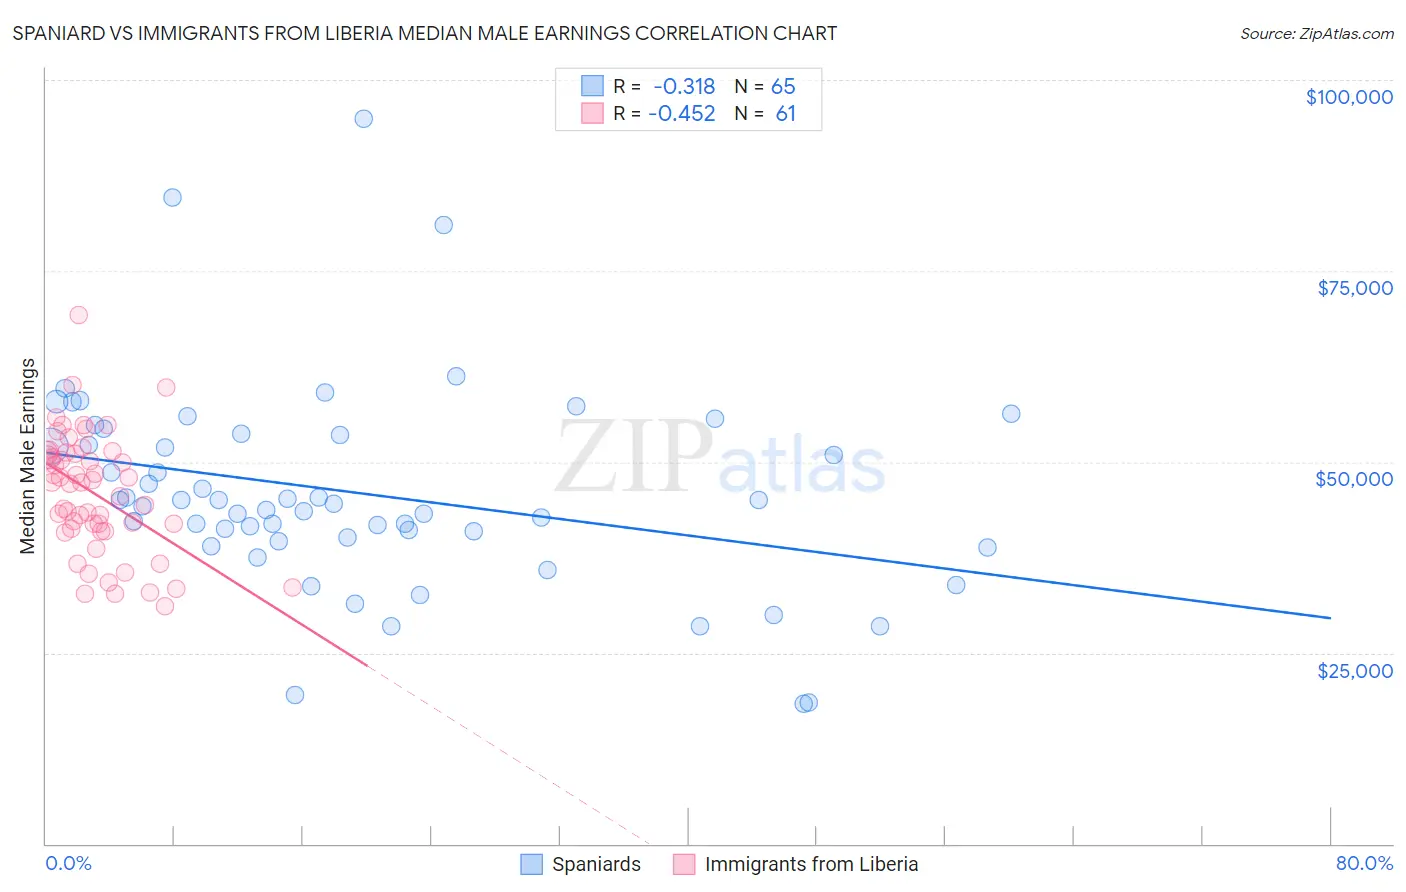
Spaniard vs Immigrants from Liberia Median Male Earnings Correlation Chart
The statistical analysis conducted on geographies consisting of 443,330,517 people shows a mild negative correlation between the proportion of Spaniards and median male earnings in the United States with a correlation coefficient (R) of -0.318 and weighted average of $54,401. Similarly, the statistical analysis conducted on geographies consisting of 135,282,382 people shows a moderate negative correlation between the proportion of Immigrants from Liberia and median male earnings in the United States with a correlation coefficient (R) of -0.452 and weighted average of $48,317, a difference of 12.6%.
Median Male Earnings Correlation Summary
| Measurement | Spaniard | Immigrants from Liberia |
| Minimum | $18,319 | $31,133 |
| Maximum | $95,000 | $69,167 |
| Range | $76,681 | $38,034 |
| Mean | $45,902 | $45,872 |
| Median | $44,474 | $47,293 |
| Interquartile 25% (IQ1) | $39,886 | $41,079 |
| Interquartile 75% (IQ3) | $53,625 | $51,125 |
| Interquartile Range (IQR) | $13,740 | $10,046 |
| Standard Deviation (Sample) | $13,482 | $7,800 |
| Standard Deviation (Population) | $13,378 | $7,735 |
Similar Demographics by Median Male Earnings
Demographics Similar to Spaniards by Median Male Earnings
In terms of median male earnings, the demographic groups most similar to Spaniards are Dutch ($54,410, a difference of 0.020%), South American ($54,492, a difference of 0.17%), South American Indian ($54,508, a difference of 0.20%), Costa Rican ($54,279, a difference of 0.22%), and Sierra Leonean ($54,279, a difference of 0.22%).
| Demographics | Rating | Rank | Median Male Earnings |
| French Canadians | 55.6 /100 | #169 | Average $54,722 |
| Finns | 55.6 /100 | #170 | Average $54,721 |
| Immigrants | Peru | 54.9 /100 | #171 | Average $54,695 |
| Welsh | 53.8 /100 | #172 | Average $54,647 |
| South American Indians | 50.4 /100 | #173 | Average $54,508 |
| South Americans | 50.0 /100 | #174 | Average $54,492 |
| Dutch | 48.0 /100 | #175 | Average $54,410 |
| Spaniards | 47.8 /100 | #176 | Average $54,401 |
| Costa Ricans | 44.8 /100 | #177 | Average $54,279 |
| Sierra Leoneans | 44.8 /100 | #178 | Average $54,279 |
| Celtics | 43.9 /100 | #179 | Average $54,242 |
| Iraqis | 42.5 /100 | #180 | Average $54,182 |
| Immigrants | Immigrants | 42.1 /100 | #181 | Average $54,168 |
| Yugoslavians | 37.4 /100 | #182 | Fair $53,967 |
| Immigrants | South America | 37.3 /100 | #183 | Fair $53,962 |
Demographics Similar to Immigrants from Liberia by Median Male Earnings
In terms of median male earnings, the demographic groups most similar to Immigrants from Liberia are Belizean ($48,358, a difference of 0.080%), Hmong ($48,254, a difference of 0.13%), Blackfeet ($48,402, a difference of 0.18%), Comanche ($48,202, a difference of 0.24%), and Immigrants from Somalia ($48,439, a difference of 0.25%).
| Demographics | Rating | Rank | Median Male Earnings |
| Cherokee | 0.3 /100 | #271 | Tragic $48,669 |
| Salvadorans | 0.3 /100 | #272 | Tragic $48,646 |
| Jamaicans | 0.3 /100 | #273 | Tragic $48,632 |
| Colville | 0.3 /100 | #274 | Tragic $48,516 |
| Immigrants | Somalia | 0.3 /100 | #275 | Tragic $48,439 |
| Blackfeet | 0.3 /100 | #276 | Tragic $48,402 |
| Belizeans | 0.2 /100 | #277 | Tragic $48,358 |
| Immigrants | Liberia | 0.2 /100 | #278 | Tragic $48,317 |
| Hmong | 0.2 /100 | #279 | Tragic $48,254 |
| Comanche | 0.2 /100 | #280 | Tragic $48,202 |
| Marshallese | 0.2 /100 | #281 | Tragic $48,137 |
| Central Americans | 0.2 /100 | #282 | Tragic $48,093 |
| Immigrants | Jamaica | 0.2 /100 | #283 | Tragic $48,040 |
| Africans | 0.2 /100 | #284 | Tragic $47,994 |
| Paiute | 0.2 /100 | #285 | Tragic $47,991 |