Marshallese vs Immigrants from Liberia 7th Grade
COMPARE
Marshallese
Immigrants from Liberia
7th Grade
7th Grade Comparison
Marshallese
Immigrants from Liberia
96.0%
7TH GRADE
48.4/ 100
METRIC RATING
178th/ 347
METRIC RANK
95.7%
7TH GRADE
8.1/ 100
METRIC RATING
218th/ 347
METRIC RANK
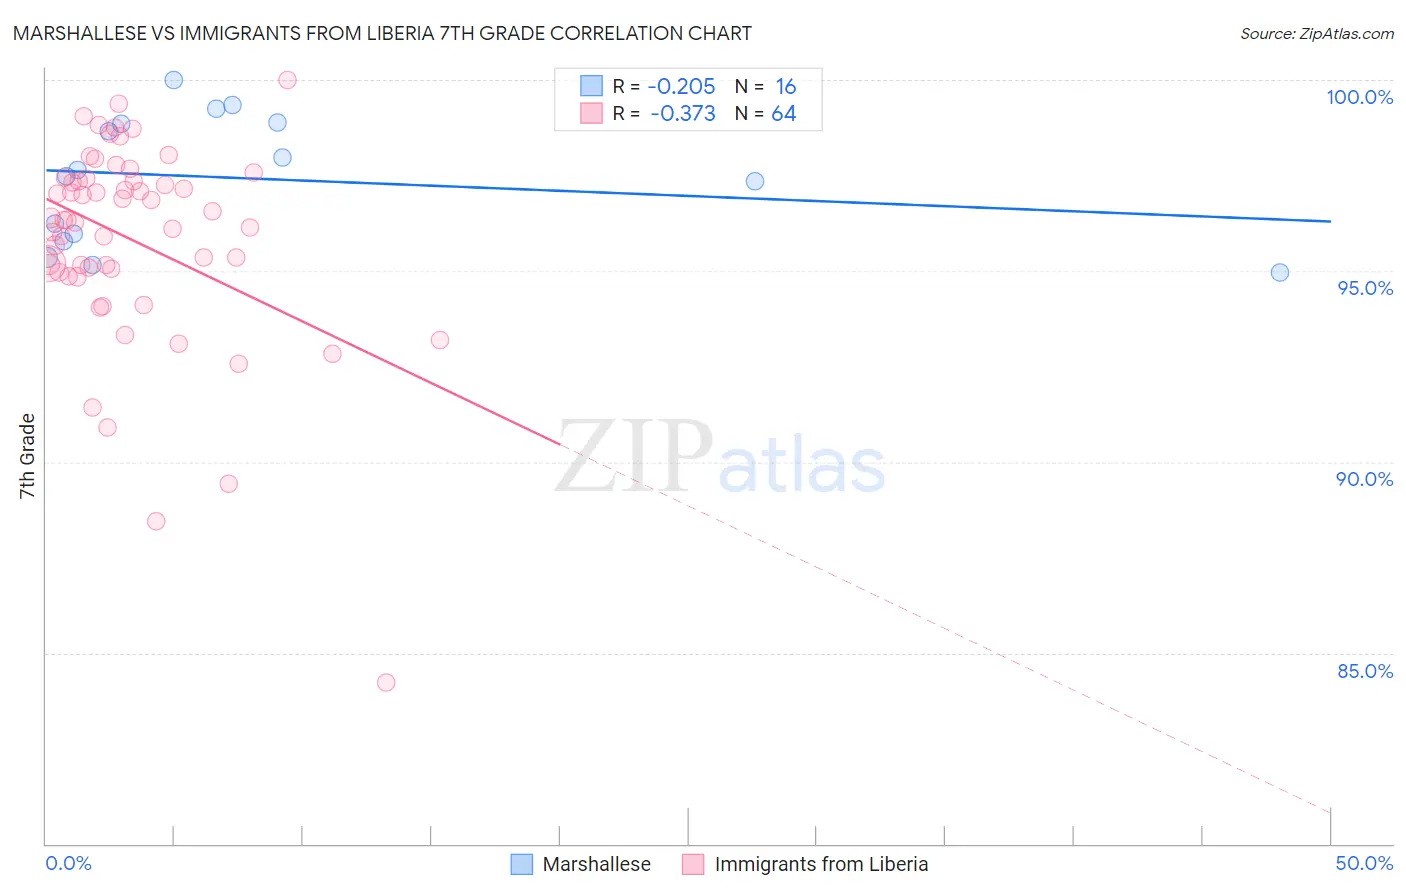
Marshallese vs Immigrants from Liberia 7th Grade Correlation Chart
The statistical analysis conducted on geographies consisting of 14,761,315 people shows a weak negative correlation between the proportion of Marshallese and percentage of population with at least 7th grade education in the United States with a correlation coefficient (R) of -0.205 and weighted average of 96.0%. Similarly, the statistical analysis conducted on geographies consisting of 135,294,272 people shows a mild negative correlation between the proportion of Immigrants from Liberia and percentage of population with at least 7th grade education in the United States with a correlation coefficient (R) of -0.373 and weighted average of 95.7%, a difference of 0.36%.
7th Grade Correlation Summary
| Measurement | Marshallese | Immigrants from Liberia |
| Minimum | 94.9% | 84.2% |
| Maximum | 100.0% | 100.0% |
| Range | 5.1% | 15.8% |
| Mean | 97.4% | 95.8% |
| Median | 97.6% | 96.3% |
| Interquartile 25% (IQ1) | 95.9% | 95.0% |
| Interquartile 75% (IQ3) | 98.9% | 97.4% |
| Interquartile Range (IQR) | 3.0% | 2.4% |
| Standard Deviation (Sample) | 1.7% | 2.7% |
| Standard Deviation (Population) | 1.6% | 2.7% |
Similar Demographics by 7th Grade
Demographics Similar to Marshallese by 7th Grade
In terms of 7th grade, the demographic groups most similar to Marshallese are Immigrants from Korea (96.0%, a difference of 0.0%), Immigrants from Iran (96.0%, a difference of 0.0%), Immigrants from Albania (96.0%, a difference of 0.010%), Mongolian (96.0%, a difference of 0.010%), and Black/African American (96.0%, a difference of 0.010%).
| Demographics | Rating | Rank | 7th Grade |
| Egyptians | 54.2 /100 | #171 | Average 96.1% |
| Venezuelans | 51.4 /100 | #172 | Average 96.0% |
| Immigrants | Albania | 50.4 /100 | #173 | Average 96.0% |
| Mongolians | 50.0 /100 | #174 | Average 96.0% |
| Blacks/African Americans | 49.5 /100 | #175 | Average 96.0% |
| Chileans | 49.3 /100 | #176 | Average 96.0% |
| Immigrants | Korea | 49.2 /100 | #177 | Average 96.0% |
| Marshallese | 48.4 /100 | #178 | Average 96.0% |
| Immigrants | Iran | 47.8 /100 | #179 | Average 96.0% |
| Immigrants | Brazil | 46.8 /100 | #180 | Average 96.0% |
| Pakistanis | 44.5 /100 | #181 | Average 96.0% |
| Iraqis | 41.2 /100 | #182 | Average 96.0% |
| Immigrants | Spain | 38.8 /100 | #183 | Fair 96.0% |
| Sierra Leoneans | 37.5 /100 | #184 | Fair 96.0% |
| Brazilians | 37.3 /100 | #185 | Fair 96.0% |
Demographics Similar to Immigrants from Liberia by 7th Grade
In terms of 7th grade, the demographic groups most similar to Immigrants from Liberia are Immigrants from Southern Europe (95.7%, a difference of 0.0%), Spanish American (95.7%, a difference of 0.020%), Immigrants from Chile (95.7%, a difference of 0.020%), Immigrants from Pakistan (95.7%, a difference of 0.020%), and Subsaharan African (95.7%, a difference of 0.020%).
| Demographics | Rating | Rank | 7th Grade |
| Portuguese | 13.6 /100 | #211 | Poor 95.8% |
| Immigrants | Lebanon | 13.0 /100 | #212 | Poor 95.8% |
| Immigrants | Morocco | 12.6 /100 | #213 | Poor 95.8% |
| Bahamians | 11.6 /100 | #214 | Poor 95.7% |
| Spanish Americans | 9.3 /100 | #215 | Tragic 95.7% |
| Immigrants | Chile | 9.1 /100 | #216 | Tragic 95.7% |
| Immigrants | Pakistan | 9.0 /100 | #217 | Tragic 95.7% |
| Immigrants | Liberia | 8.1 /100 | #218 | Tragic 95.7% |
| Immigrants | Southern Europe | 7.9 /100 | #219 | Tragic 95.7% |
| Sub-Saharan Africans | 7.2 /100 | #220 | Tragic 95.7% |
| Samoans | 7.0 /100 | #221 | Tragic 95.7% |
| Laotians | 6.8 /100 | #222 | Tragic 95.7% |
| Immigrants | Syria | 6.7 /100 | #223 | Tragic 95.7% |
| Immigrants | Oceania | 6.7 /100 | #224 | Tragic 95.7% |
| Immigrants | Malaysia | 6.2 /100 | #225 | Tragic 95.6% |