Immigrants from Nicaragua vs Immigrants from Liberia Median Male Earnings
COMPARE
Immigrants from Nicaragua
Immigrants from Liberia
Median Male Earnings
Median Male Earnings Comparison
Immigrants from Nicaragua
Immigrants from Liberia
$47,482
MEDIAN MALE EARNINGS
0.1/ 100
METRIC RATING
294th/ 347
METRIC RANK
$48,317
MEDIAN MALE EARNINGS
0.2/ 100
METRIC RATING
278th/ 347
METRIC RANK
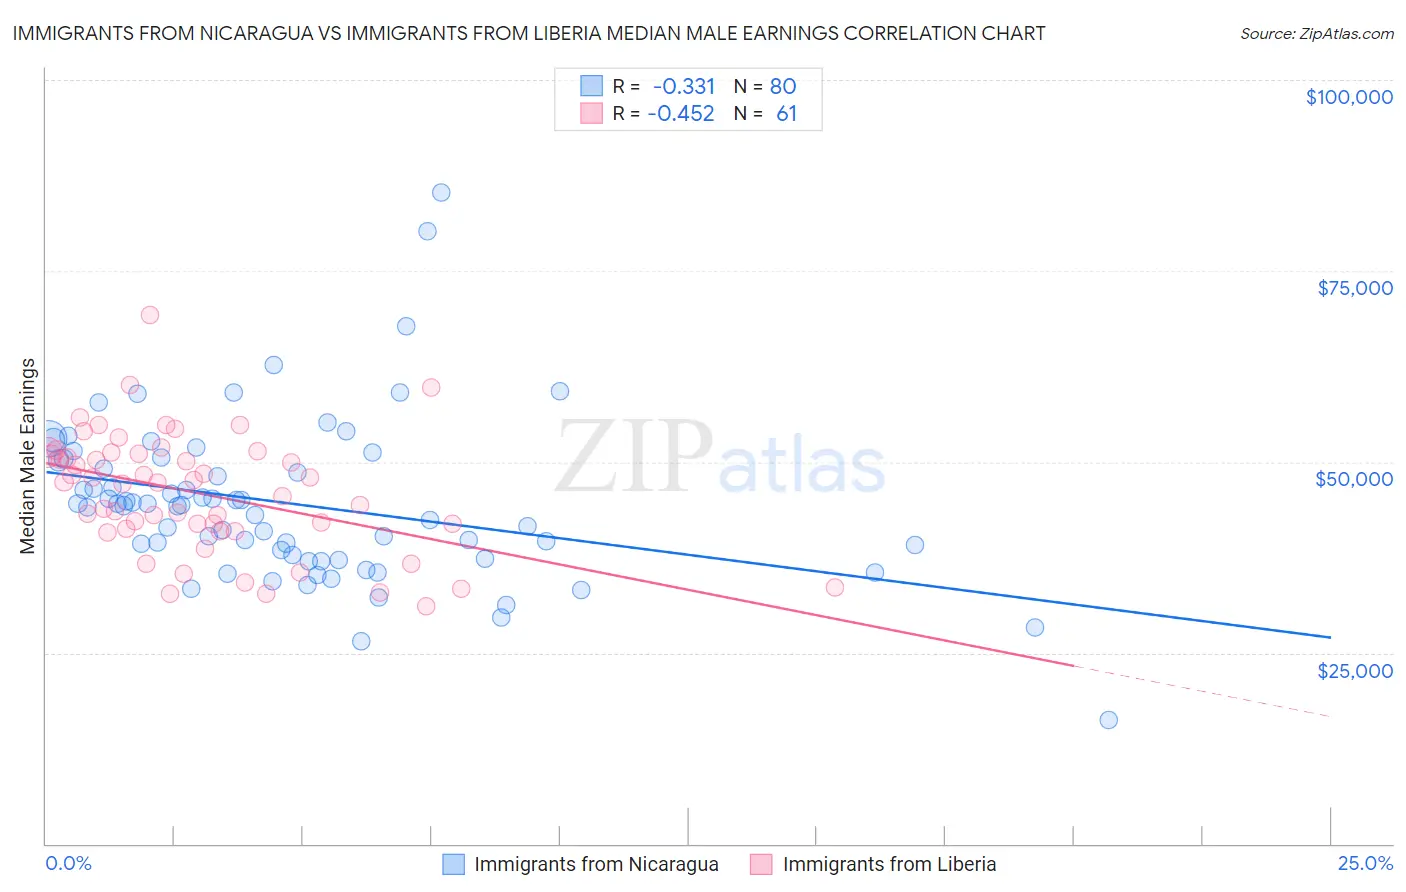
Immigrants from Nicaragua vs Immigrants from Liberia Median Male Earnings Correlation Chart
The statistical analysis conducted on geographies consisting of 236,305,617 people shows a mild negative correlation between the proportion of Immigrants from Nicaragua and median male earnings in the United States with a correlation coefficient (R) of -0.331 and weighted average of $47,482. Similarly, the statistical analysis conducted on geographies consisting of 135,282,382 people shows a moderate negative correlation between the proportion of Immigrants from Liberia and median male earnings in the United States with a correlation coefficient (R) of -0.452 and weighted average of $48,317, a difference of 1.8%.
Median Male Earnings Correlation Summary
| Measurement | Immigrants from Nicaragua | Immigrants from Liberia |
| Minimum | $16,250 | $31,133 |
| Maximum | $85,319 | $69,167 |
| Range | $69,069 | $38,034 |
| Mean | $44,541 | $45,872 |
| Median | $44,356 | $47,293 |
| Interquartile 25% (IQ1) | $37,535 | $41,079 |
| Interquartile 75% (IQ3) | $50,283 | $51,125 |
| Interquartile Range (IQR) | $12,748 | $10,046 |
| Standard Deviation (Sample) | $10,745 | $7,800 |
| Standard Deviation (Population) | $10,678 | $7,735 |
Demographics Similar to Immigrants from Nicaragua and Immigrants from Liberia by Median Male Earnings
In terms of median male earnings, the demographic groups most similar to Immigrants from Nicaragua are Indonesian ($47,503, a difference of 0.040%), Central American Indian ($47,433, a difference of 0.10%), Immigrants from Dominica ($47,651, a difference of 0.36%), Inupiat ($47,281, a difference of 0.43%), and Choctaw ($47,729, a difference of 0.52%). Similarly, the demographic groups most similar to Immigrants from Liberia are Belizean ($48,358, a difference of 0.080%), Hmong ($48,254, a difference of 0.13%), Blackfeet ($48,402, a difference of 0.18%), Comanche ($48,202, a difference of 0.24%), and Marshallese ($48,137, a difference of 0.37%).
| Demographics | Rating | Rank | Median Male Earnings |
| Blackfeet | 0.3 /100 | #276 | Tragic $48,402 |
| Belizeans | 0.2 /100 | #277 | Tragic $48,358 |
| Immigrants | Liberia | 0.2 /100 | #278 | Tragic $48,317 |
| Hmong | 0.2 /100 | #279 | Tragic $48,254 |
| Comanche | 0.2 /100 | #280 | Tragic $48,202 |
| Marshallese | 0.2 /100 | #281 | Tragic $48,137 |
| Central Americans | 0.2 /100 | #282 | Tragic $48,093 |
| Immigrants | Jamaica | 0.2 /100 | #283 | Tragic $48,040 |
| Africans | 0.2 /100 | #284 | Tragic $47,994 |
| Paiute | 0.2 /100 | #285 | Tragic $47,991 |
| Mexican American Indians | 0.2 /100 | #286 | Tragic $47,990 |
| Immigrants | El Salvador | 0.2 /100 | #287 | Tragic $47,973 |
| Shoshone | 0.2 /100 | #288 | Tragic $47,930 |
| Chickasaw | 0.1 /100 | #289 | Tragic $47,832 |
| Immigrants | Belize | 0.1 /100 | #290 | Tragic $47,809 |
| Choctaw | 0.1 /100 | #291 | Tragic $47,729 |
| Immigrants | Dominica | 0.1 /100 | #292 | Tragic $47,651 |
| Indonesians | 0.1 /100 | #293 | Tragic $47,503 |
| Immigrants | Nicaragua | 0.1 /100 | #294 | Tragic $47,482 |
| Central American Indians | 0.1 /100 | #295 | Tragic $47,433 |
| Inupiat | 0.1 /100 | #296 | Tragic $47,281 |