Marshallese vs Sudanese Median Male Earnings
COMPARE
Marshallese
Sudanese
Median Male Earnings
Median Male Earnings Comparison
Marshallese
Sudanese
$48,137
MEDIAN MALE EARNINGS
0.2/ 100
METRIC RATING
281st/ 347
METRIC RANK
$51,216
MEDIAN MALE EARNINGS
3.9/ 100
METRIC RATING
232nd/ 347
METRIC RANK
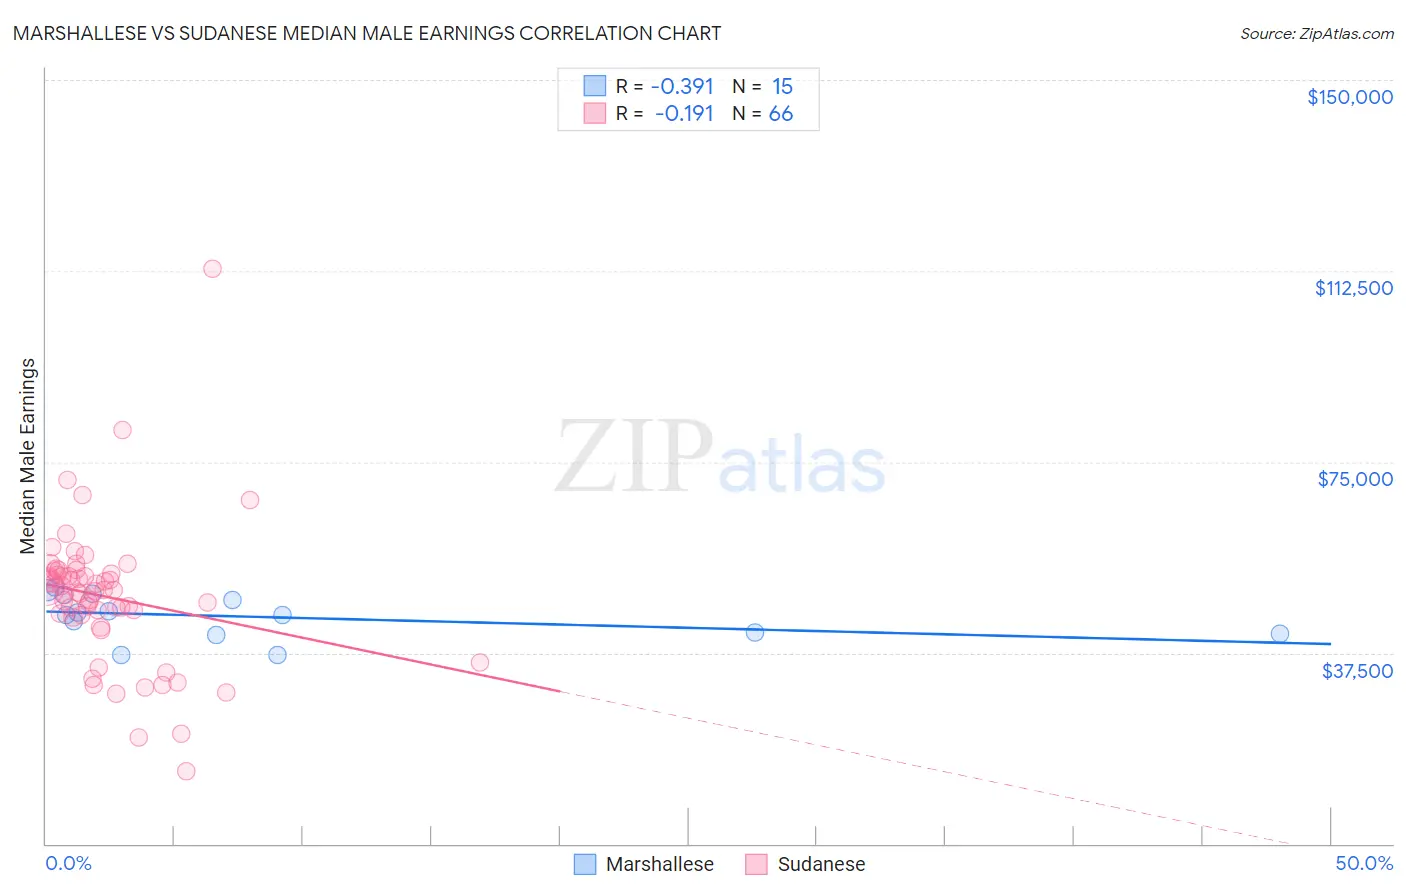
Marshallese vs Sudanese Median Male Earnings Correlation Chart
The statistical analysis conducted on geographies consisting of 14,760,790 people shows a mild negative correlation between the proportion of Marshallese and median male earnings in the United States with a correlation coefficient (R) of -0.391 and weighted average of $48,137. Similarly, the statistical analysis conducted on geographies consisting of 110,150,959 people shows a poor negative correlation between the proportion of Sudanese and median male earnings in the United States with a correlation coefficient (R) of -0.191 and weighted average of $51,216, a difference of 6.4%.
Median Male Earnings Correlation Summary
| Measurement | Marshallese | Sudanese |
| Minimum | $37,012 | $14,310 |
| Maximum | $50,395 | $113,008 |
| Range | $13,383 | $98,698 |
| Mean | $44,583 | $48,489 |
| Median | $45,000 | $49,650 |
| Interquartile 25% (IQ1) | $41,333 | $44,972 |
| Interquartile 75% (IQ3) | $48,969 | $53,130 |
| Interquartile Range (IQR) | $7,636 | $8,158 |
| Standard Deviation (Sample) | $4,286 | $14,082 |
| Standard Deviation (Population) | $4,141 | $13,975 |
Similar Demographics by Median Male Earnings
Demographics Similar to Marshallese by Median Male Earnings
In terms of median male earnings, the demographic groups most similar to Marshallese are Central American ($48,093, a difference of 0.090%), Comanche ($48,202, a difference of 0.13%), Immigrants from Jamaica ($48,040, a difference of 0.20%), Hmong ($48,254, a difference of 0.24%), and African ($47,994, a difference of 0.30%).
| Demographics | Rating | Rank | Median Male Earnings |
| Colville | 0.3 /100 | #274 | Tragic $48,516 |
| Immigrants | Somalia | 0.3 /100 | #275 | Tragic $48,439 |
| Blackfeet | 0.3 /100 | #276 | Tragic $48,402 |
| Belizeans | 0.2 /100 | #277 | Tragic $48,358 |
| Immigrants | Liberia | 0.2 /100 | #278 | Tragic $48,317 |
| Hmong | 0.2 /100 | #279 | Tragic $48,254 |
| Comanche | 0.2 /100 | #280 | Tragic $48,202 |
| Marshallese | 0.2 /100 | #281 | Tragic $48,137 |
| Central Americans | 0.2 /100 | #282 | Tragic $48,093 |
| Immigrants | Jamaica | 0.2 /100 | #283 | Tragic $48,040 |
| Africans | 0.2 /100 | #284 | Tragic $47,994 |
| Paiute | 0.2 /100 | #285 | Tragic $47,991 |
| Mexican American Indians | 0.2 /100 | #286 | Tragic $47,990 |
| Immigrants | El Salvador | 0.2 /100 | #287 | Tragic $47,973 |
| Shoshone | 0.2 /100 | #288 | Tragic $47,930 |
Demographics Similar to Sudanese by Median Male Earnings
In terms of median male earnings, the demographic groups most similar to Sudanese are Barbadian ($51,236, a difference of 0.040%), Aleut ($51,168, a difference of 0.090%), Immigrants from Nigeria ($51,310, a difference of 0.18%), Cape Verdean ($51,103, a difference of 0.22%), and Immigrants from Trinidad and Tobago ($51,376, a difference of 0.31%).
| Demographics | Rating | Rank | Median Male Earnings |
| Immigrants | Sudan | 5.0 /100 | #225 | Tragic $51,489 |
| Japanese | 4.9 /100 | #226 | Tragic $51,473 |
| Trinidadians and Tobagonians | 4.8 /100 | #227 | Tragic $51,446 |
| Samoans | 4.6 /100 | #228 | Tragic $51,389 |
| Immigrants | Trinidad and Tobago | 4.5 /100 | #229 | Tragic $51,376 |
| Immigrants | Nigeria | 4.2 /100 | #230 | Tragic $51,310 |
| Barbadians | 3.9 /100 | #231 | Tragic $51,236 |
| Sudanese | 3.9 /100 | #232 | Tragic $51,216 |
| Aleuts | 3.7 /100 | #233 | Tragic $51,168 |
| Cape Verdeans | 3.5 /100 | #234 | Tragic $51,103 |
| Immigrants | Western Africa | 3.0 /100 | #235 | Tragic $50,940 |
| Pennsylvania Germans | 2.8 /100 | #236 | Tragic $50,878 |
| Immigrants | Barbados | 2.6 /100 | #237 | Tragic $50,795 |
| Malaysians | 2.5 /100 | #238 | Tragic $50,772 |
| Americans | 2.5 /100 | #239 | Tragic $50,761 |