Marshallese vs Carpatho Rusyn Median Male Earnings
COMPARE
Marshallese
Carpatho Rusyn
Median Male Earnings
Median Male Earnings Comparison
Marshallese
Carpatho Rusyns
$48,137
MEDIAN MALE EARNINGS
0.2/ 100
METRIC RATING
281st/ 347
METRIC RANK
$57,572
MEDIAN MALE EARNINGS
95.3/ 100
METRIC RATING
113th/ 347
METRIC RANK
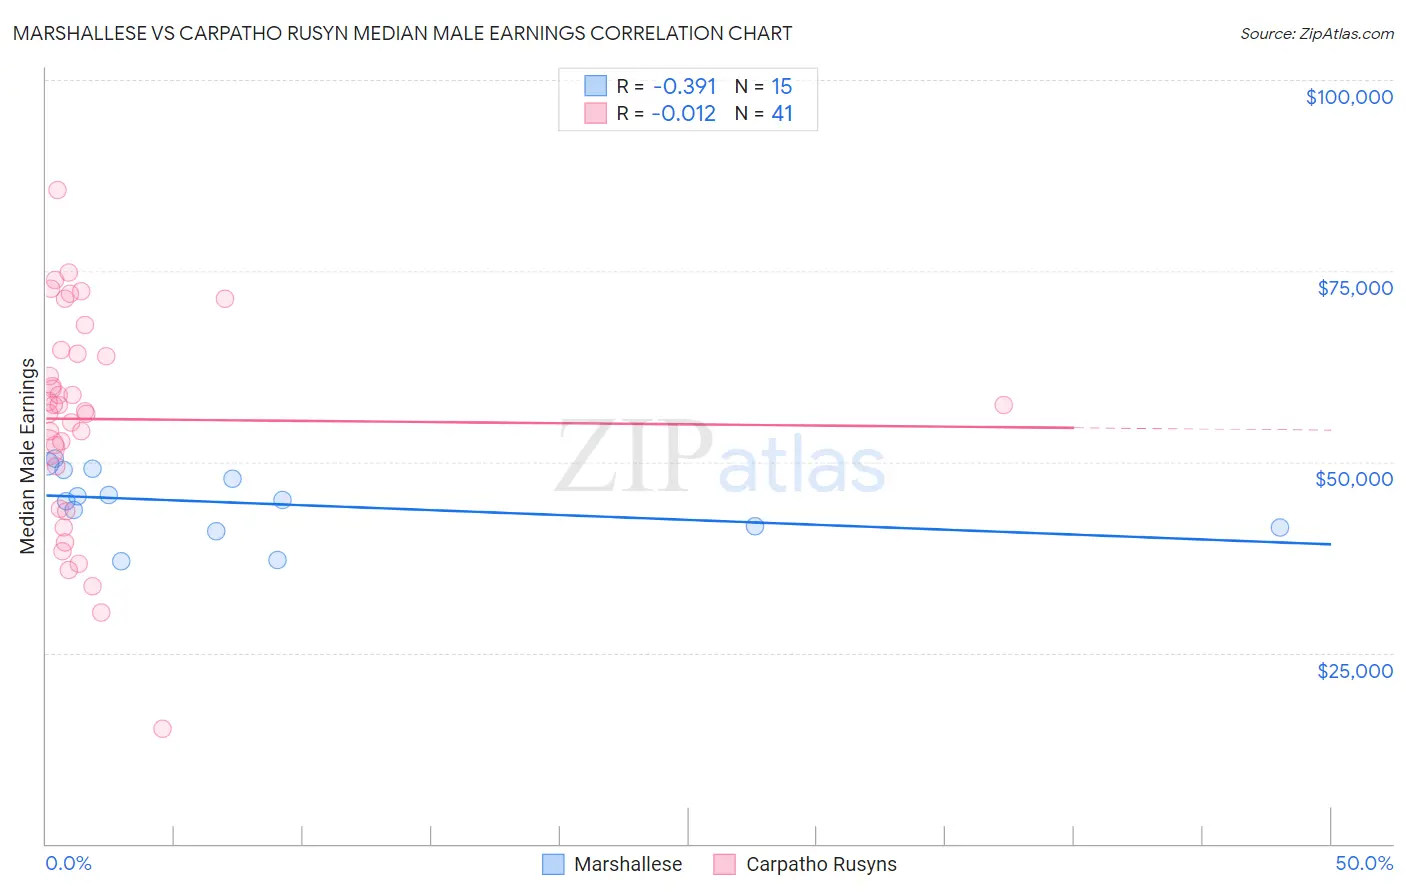
Marshallese vs Carpatho Rusyn Median Male Earnings Correlation Chart
The statistical analysis conducted on geographies consisting of 14,760,790 people shows a mild negative correlation between the proportion of Marshallese and median male earnings in the United States with a correlation coefficient (R) of -0.391 and weighted average of $48,137. Similarly, the statistical analysis conducted on geographies consisting of 58,862,900 people shows no correlation between the proportion of Carpatho Rusyns and median male earnings in the United States with a correlation coefficient (R) of -0.012 and weighted average of $57,572, a difference of 19.6%.
Median Male Earnings Correlation Summary
| Measurement | Marshallese | Carpatho Rusyn |
| Minimum | $37,012 | $15,000 |
| Maximum | $50,395 | $85,583 |
| Range | $13,383 | $70,583 |
| Mean | $44,583 | $55,604 |
| Median | $45,000 | $57,395 |
| Interquartile 25% (IQ1) | $41,333 | $46,688 |
| Interquartile 75% (IQ3) | $48,969 | $64,386 |
| Interquartile Range (IQR) | $7,636 | $17,699 |
| Standard Deviation (Sample) | $4,286 | $14,187 |
| Standard Deviation (Population) | $4,141 | $14,013 |
Similar Demographics by Median Male Earnings
Demographics Similar to Marshallese by Median Male Earnings
In terms of median male earnings, the demographic groups most similar to Marshallese are Central American ($48,093, a difference of 0.090%), Comanche ($48,202, a difference of 0.13%), Immigrants from Jamaica ($48,040, a difference of 0.20%), Hmong ($48,254, a difference of 0.24%), and African ($47,994, a difference of 0.30%).
| Demographics | Rating | Rank | Median Male Earnings |
| Colville | 0.3 /100 | #274 | Tragic $48,516 |
| Immigrants | Somalia | 0.3 /100 | #275 | Tragic $48,439 |
| Blackfeet | 0.3 /100 | #276 | Tragic $48,402 |
| Belizeans | 0.2 /100 | #277 | Tragic $48,358 |
| Immigrants | Liberia | 0.2 /100 | #278 | Tragic $48,317 |
| Hmong | 0.2 /100 | #279 | Tragic $48,254 |
| Comanche | 0.2 /100 | #280 | Tragic $48,202 |
| Marshallese | 0.2 /100 | #281 | Tragic $48,137 |
| Central Americans | 0.2 /100 | #282 | Tragic $48,093 |
| Immigrants | Jamaica | 0.2 /100 | #283 | Tragic $48,040 |
| Africans | 0.2 /100 | #284 | Tragic $47,994 |
| Paiute | 0.2 /100 | #285 | Tragic $47,991 |
| Mexican American Indians | 0.2 /100 | #286 | Tragic $47,990 |
| Immigrants | El Salvador | 0.2 /100 | #287 | Tragic $47,973 |
| Shoshone | 0.2 /100 | #288 | Tragic $47,930 |
Demographics Similar to Carpatho Rusyns by Median Male Earnings
In terms of median male earnings, the demographic groups most similar to Carpatho Rusyns are Immigrants from Afghanistan ($57,582, a difference of 0.020%), Immigrants from Kuwait ($57,562, a difference of 0.020%), European ($57,637, a difference of 0.11%), Swedish ($57,445, a difference of 0.22%), and Lebanese ($57,409, a difference of 0.28%).
| Demographics | Rating | Rank | Median Male Earnings |
| Immigrants | Northern Africa | 96.9 /100 | #106 | Exceptional $58,008 |
| Serbians | 96.8 /100 | #107 | Exceptional $57,975 |
| Immigrants | Uzbekistan | 96.7 /100 | #108 | Exceptional $57,941 |
| British | 96.5 /100 | #109 | Exceptional $57,890 |
| Palestinians | 96.2 /100 | #110 | Exceptional $57,778 |
| Europeans | 95.6 /100 | #111 | Exceptional $57,637 |
| Immigrants | Afghanistan | 95.4 /100 | #112 | Exceptional $57,582 |
| Carpatho Rusyns | 95.3 /100 | #113 | Exceptional $57,572 |
| Immigrants | Kuwait | 95.3 /100 | #114 | Exceptional $57,562 |
| Swedes | 94.8 /100 | #115 | Exceptional $57,445 |
| Lebanese | 94.6 /100 | #116 | Exceptional $57,409 |
| Immigrants | Zimbabwe | 94.3 /100 | #117 | Exceptional $57,352 |
| Hungarians | 94.0 /100 | #118 | Exceptional $57,309 |
| Arabs | 94.0 /100 | #119 | Exceptional $57,298 |
| Canadians | 93.9 /100 | #120 | Exceptional $57,286 |