Marshallese vs Immigrants from Peru Median Male Earnings
COMPARE
Marshallese
Immigrants from Peru
Median Male Earnings
Median Male Earnings Comparison
Marshallese
Immigrants from Peru
$48,137
MEDIAN MALE EARNINGS
0.2/ 100
METRIC RATING
281st/ 347
METRIC RANK
$54,695
MEDIAN MALE EARNINGS
54.9/ 100
METRIC RATING
171st/ 347
METRIC RANK
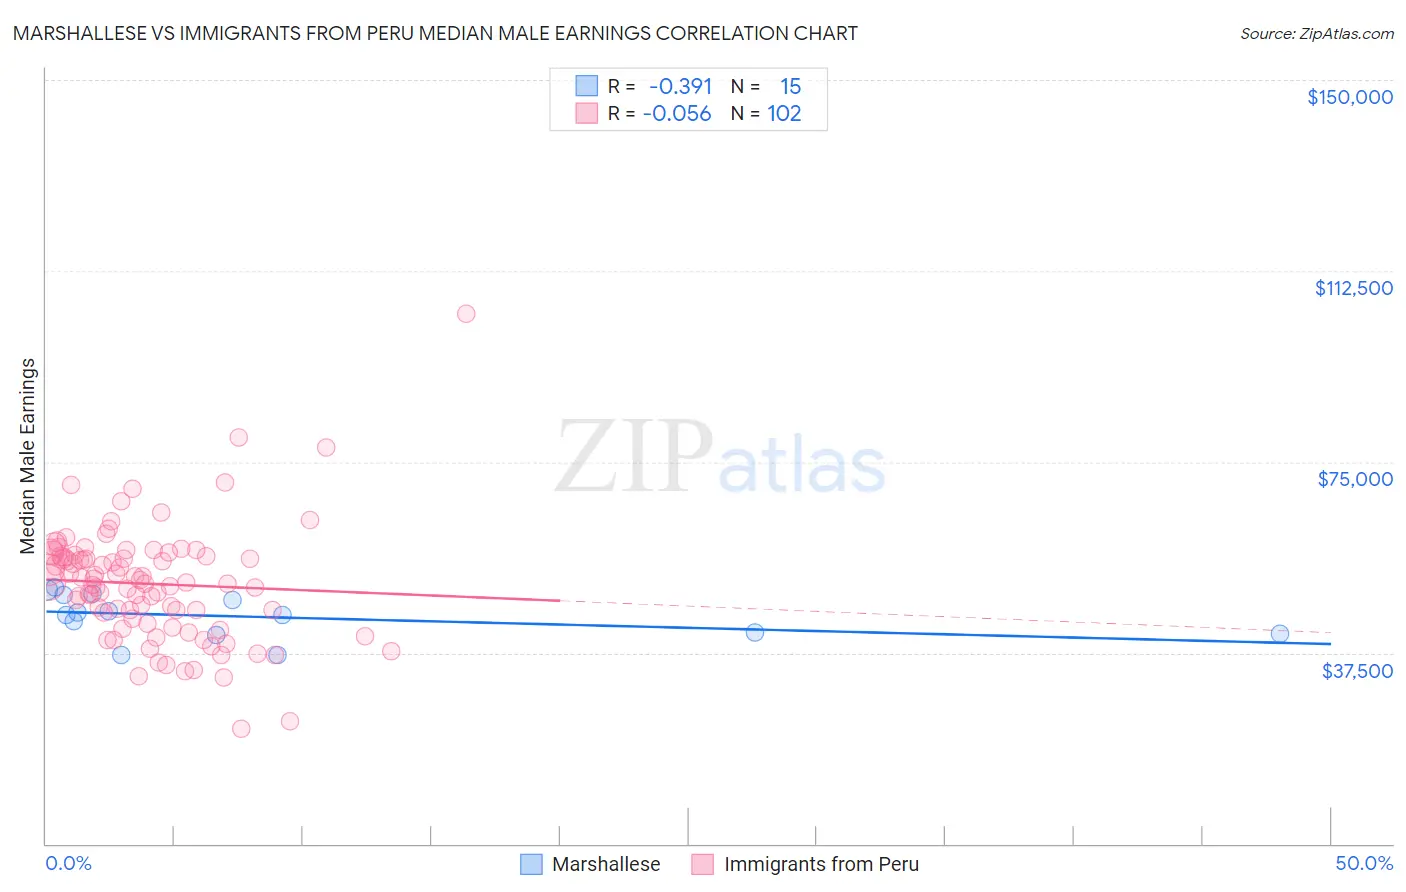
Marshallese vs Immigrants from Peru Median Male Earnings Correlation Chart
The statistical analysis conducted on geographies consisting of 14,760,790 people shows a mild negative correlation between the proportion of Marshallese and median male earnings in the United States with a correlation coefficient (R) of -0.391 and weighted average of $48,137. Similarly, the statistical analysis conducted on geographies consisting of 328,805,303 people shows a slight negative correlation between the proportion of Immigrants from Peru and median male earnings in the United States with a correlation coefficient (R) of -0.056 and weighted average of $54,695, a difference of 13.6%.
Median Male Earnings Correlation Summary
| Measurement | Marshallese | Immigrants from Peru |
| Minimum | $37,012 | $22,560 |
| Maximum | $50,395 | $104,038 |
| Range | $13,383 | $81,478 |
| Mean | $44,583 | $51,057 |
| Median | $45,000 | $51,289 |
| Interquartile 25% (IQ1) | $41,333 | $44,299 |
| Interquartile 75% (IQ3) | $48,969 | $56,461 |
| Interquartile Range (IQR) | $7,636 | $12,162 |
| Standard Deviation (Sample) | $4,286 | $11,444 |
| Standard Deviation (Population) | $4,141 | $11,388 |
Similar Demographics by Median Male Earnings
Demographics Similar to Marshallese by Median Male Earnings
In terms of median male earnings, the demographic groups most similar to Marshallese are Central American ($48,093, a difference of 0.090%), Comanche ($48,202, a difference of 0.13%), Immigrants from Jamaica ($48,040, a difference of 0.20%), Hmong ($48,254, a difference of 0.24%), and African ($47,994, a difference of 0.30%).
| Demographics | Rating | Rank | Median Male Earnings |
| Colville | 0.3 /100 | #274 | Tragic $48,516 |
| Immigrants | Somalia | 0.3 /100 | #275 | Tragic $48,439 |
| Blackfeet | 0.3 /100 | #276 | Tragic $48,402 |
| Belizeans | 0.2 /100 | #277 | Tragic $48,358 |
| Immigrants | Liberia | 0.2 /100 | #278 | Tragic $48,317 |
| Hmong | 0.2 /100 | #279 | Tragic $48,254 |
| Comanche | 0.2 /100 | #280 | Tragic $48,202 |
| Marshallese | 0.2 /100 | #281 | Tragic $48,137 |
| Central Americans | 0.2 /100 | #282 | Tragic $48,093 |
| Immigrants | Jamaica | 0.2 /100 | #283 | Tragic $48,040 |
| Africans | 0.2 /100 | #284 | Tragic $47,994 |
| Paiute | 0.2 /100 | #285 | Tragic $47,991 |
| Mexican American Indians | 0.2 /100 | #286 | Tragic $47,990 |
| Immigrants | El Salvador | 0.2 /100 | #287 | Tragic $47,973 |
| Shoshone | 0.2 /100 | #288 | Tragic $47,930 |
Demographics Similar to Immigrants from Peru by Median Male Earnings
In terms of median male earnings, the demographic groups most similar to Immigrants from Peru are French Canadian ($54,722, a difference of 0.050%), Finnish ($54,721, a difference of 0.050%), Welsh ($54,647, a difference of 0.090%), South American Indian ($54,508, a difference of 0.34%), and South American ($54,492, a difference of 0.37%).
| Demographics | Rating | Rank | Median Male Earnings |
| Immigrants | South Eastern Asia | 67.6 /100 | #164 | Good $55,241 |
| Immigrants | Portugal | 66.3 /100 | #165 | Good $55,182 |
| Germans | 61.6 /100 | #166 | Good $54,974 |
| Immigrants | Fiji | 61.2 /100 | #167 | Good $54,958 |
| Immigrants | Vietnam | 60.2 /100 | #168 | Good $54,913 |
| French Canadians | 55.6 /100 | #169 | Average $54,722 |
| Finns | 55.6 /100 | #170 | Average $54,721 |
| Immigrants | Peru | 54.9 /100 | #171 | Average $54,695 |
| Welsh | 53.8 /100 | #172 | Average $54,647 |
| South American Indians | 50.4 /100 | #173 | Average $54,508 |
| South Americans | 50.0 /100 | #174 | Average $54,492 |
| Dutch | 48.0 /100 | #175 | Average $54,410 |
| Spaniards | 47.8 /100 | #176 | Average $54,401 |
| Costa Ricans | 44.8 /100 | #177 | Average $54,279 |
| Sierra Leoneans | 44.8 /100 | #178 | Average $54,279 |