Spanish vs Immigrants from Liberia Median Male Earnings
COMPARE
Spanish
Immigrants from Liberia
Median Male Earnings
Median Male Earnings Comparison
Spanish
Immigrants from Liberia
$53,576
MEDIAN MALE EARNINGS
29.0/ 100
METRIC RATING
194th/ 347
METRIC RANK
$48,317
MEDIAN MALE EARNINGS
0.2/ 100
METRIC RATING
278th/ 347
METRIC RANK
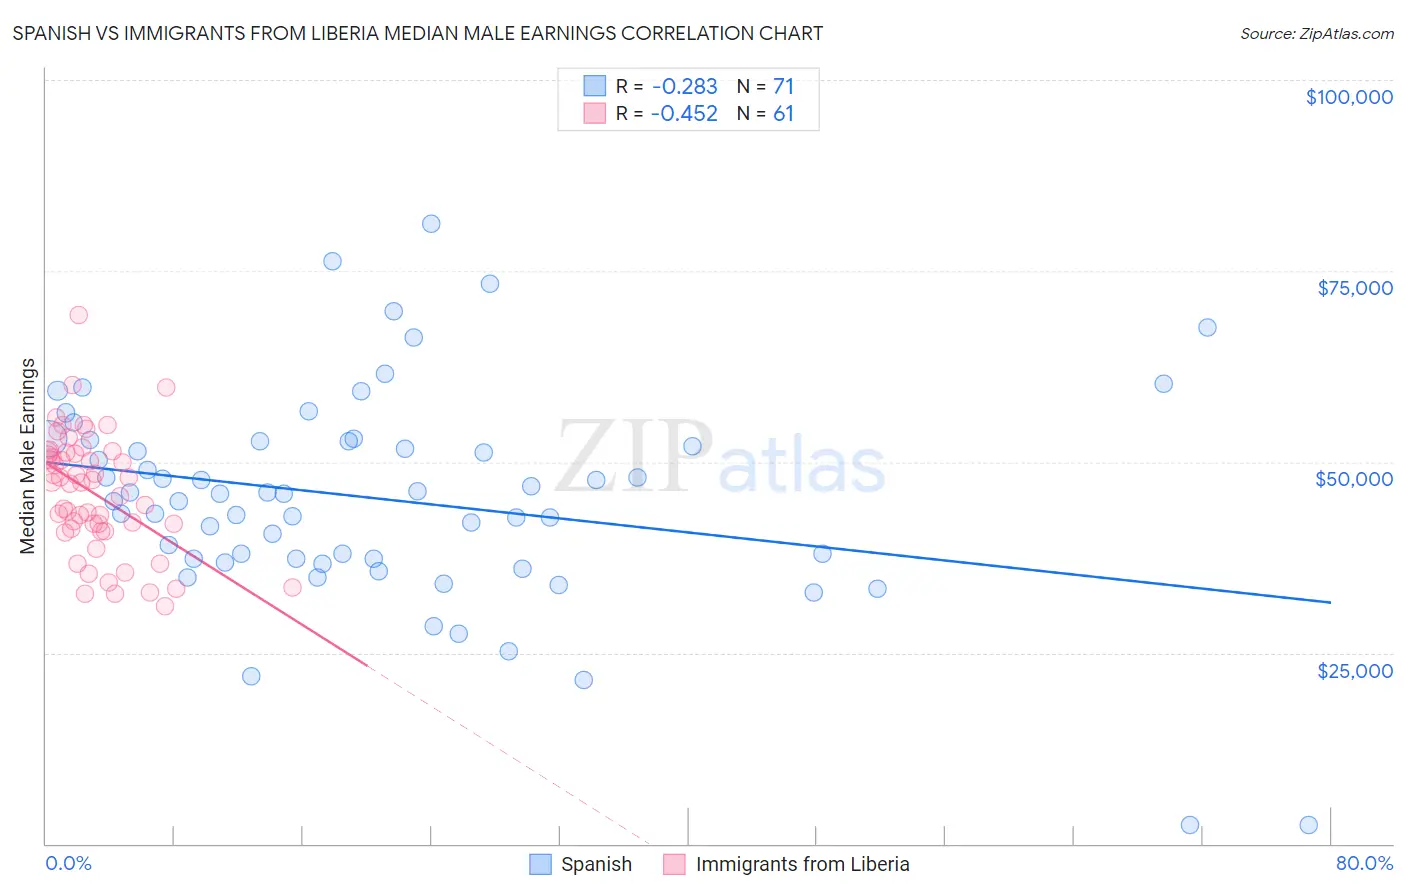
Spanish vs Immigrants from Liberia Median Male Earnings Correlation Chart
The statistical analysis conducted on geographies consisting of 421,997,889 people shows a weak negative correlation between the proportion of Spanish and median male earnings in the United States with a correlation coefficient (R) of -0.283 and weighted average of $53,576. Similarly, the statistical analysis conducted on geographies consisting of 135,282,382 people shows a moderate negative correlation between the proportion of Immigrants from Liberia and median male earnings in the United States with a correlation coefficient (R) of -0.452 and weighted average of $48,317, a difference of 10.9%.
Median Male Earnings Correlation Summary
| Measurement | Spanish | Immigrants from Liberia |
| Minimum | $2,499 | $31,133 |
| Maximum | $81,250 | $69,167 |
| Range | $78,751 | $38,034 |
| Mean | $45,106 | $45,872 |
| Median | $45,773 | $47,293 |
| Interquartile 25% (IQ1) | $37,348 | $41,079 |
| Interquartile 75% (IQ3) | $52,702 | $51,125 |
| Interquartile Range (IQR) | $15,354 | $10,046 |
| Standard Deviation (Sample) | $14,070 | $7,800 |
| Standard Deviation (Population) | $13,971 | $7,735 |
Similar Demographics by Median Male Earnings
Demographics Similar to Spanish by Median Male Earnings
In terms of median male earnings, the demographic groups most similar to Spanish are Kenyan ($53,647, a difference of 0.13%), Immigrants from the Azores ($53,503, a difference of 0.14%), Scotch-Irish ($53,658, a difference of 0.15%), Guamanian/Chamorro ($53,661, a difference of 0.16%), and Uruguayan ($53,680, a difference of 0.19%).
| Demographics | Rating | Rank | Median Male Earnings |
| Immigrants | Eritrea | 31.8 /100 | #187 | Fair $53,715 |
| Immigrants | Eastern Africa | 31.8 /100 | #188 | Fair $53,713 |
| Puget Sound Salish | 31.6 /100 | #189 | Fair $53,704 |
| Uruguayans | 31.1 /100 | #190 | Fair $53,680 |
| Guamanians/Chamorros | 30.7 /100 | #191 | Fair $53,661 |
| Scotch-Irish | 30.6 /100 | #192 | Fair $53,658 |
| Kenyans | 30.4 /100 | #193 | Fair $53,647 |
| Spanish | 29.0 /100 | #194 | Fair $53,576 |
| Immigrants | Azores | 27.5 /100 | #195 | Fair $53,503 |
| Immigrants | Africa | 26.6 /100 | #196 | Fair $53,457 |
| Immigrants | Kenya | 26.0 /100 | #197 | Fair $53,427 |
| Immigrants | Costa Rica | 22.6 /100 | #198 | Fair $53,237 |
| Tongans | 22.3 /100 | #199 | Fair $53,218 |
| Immigrants | Thailand | 17.5 /100 | #200 | Poor $52,908 |
| Immigrants | Bosnia and Herzegovina | 16.9 /100 | #201 | Poor $52,869 |
Demographics Similar to Immigrants from Liberia by Median Male Earnings
In terms of median male earnings, the demographic groups most similar to Immigrants from Liberia are Belizean ($48,358, a difference of 0.080%), Hmong ($48,254, a difference of 0.13%), Blackfeet ($48,402, a difference of 0.18%), Comanche ($48,202, a difference of 0.24%), and Immigrants from Somalia ($48,439, a difference of 0.25%).
| Demographics | Rating | Rank | Median Male Earnings |
| Cherokee | 0.3 /100 | #271 | Tragic $48,669 |
| Salvadorans | 0.3 /100 | #272 | Tragic $48,646 |
| Jamaicans | 0.3 /100 | #273 | Tragic $48,632 |
| Colville | 0.3 /100 | #274 | Tragic $48,516 |
| Immigrants | Somalia | 0.3 /100 | #275 | Tragic $48,439 |
| Blackfeet | 0.3 /100 | #276 | Tragic $48,402 |
| Belizeans | 0.2 /100 | #277 | Tragic $48,358 |
| Immigrants | Liberia | 0.2 /100 | #278 | Tragic $48,317 |
| Hmong | 0.2 /100 | #279 | Tragic $48,254 |
| Comanche | 0.2 /100 | #280 | Tragic $48,202 |
| Marshallese | 0.2 /100 | #281 | Tragic $48,137 |
| Central Americans | 0.2 /100 | #282 | Tragic $48,093 |
| Immigrants | Jamaica | 0.2 /100 | #283 | Tragic $48,040 |
| Africans | 0.2 /100 | #284 | Tragic $47,994 |
| Paiute | 0.2 /100 | #285 | Tragic $47,991 |