Malaysian vs Arab Vision Disability
COMPARE
Malaysian
Arab
Vision Disability
Vision Disability Comparison
Malaysians
Arabs
2.3%
VISION DISABILITY
0.9/ 100
METRIC RATING
241st/ 347
METRIC RANK
2.1%
VISION DISABILITY
86.3/ 100
METRIC RATING
138th/ 347
METRIC RANK
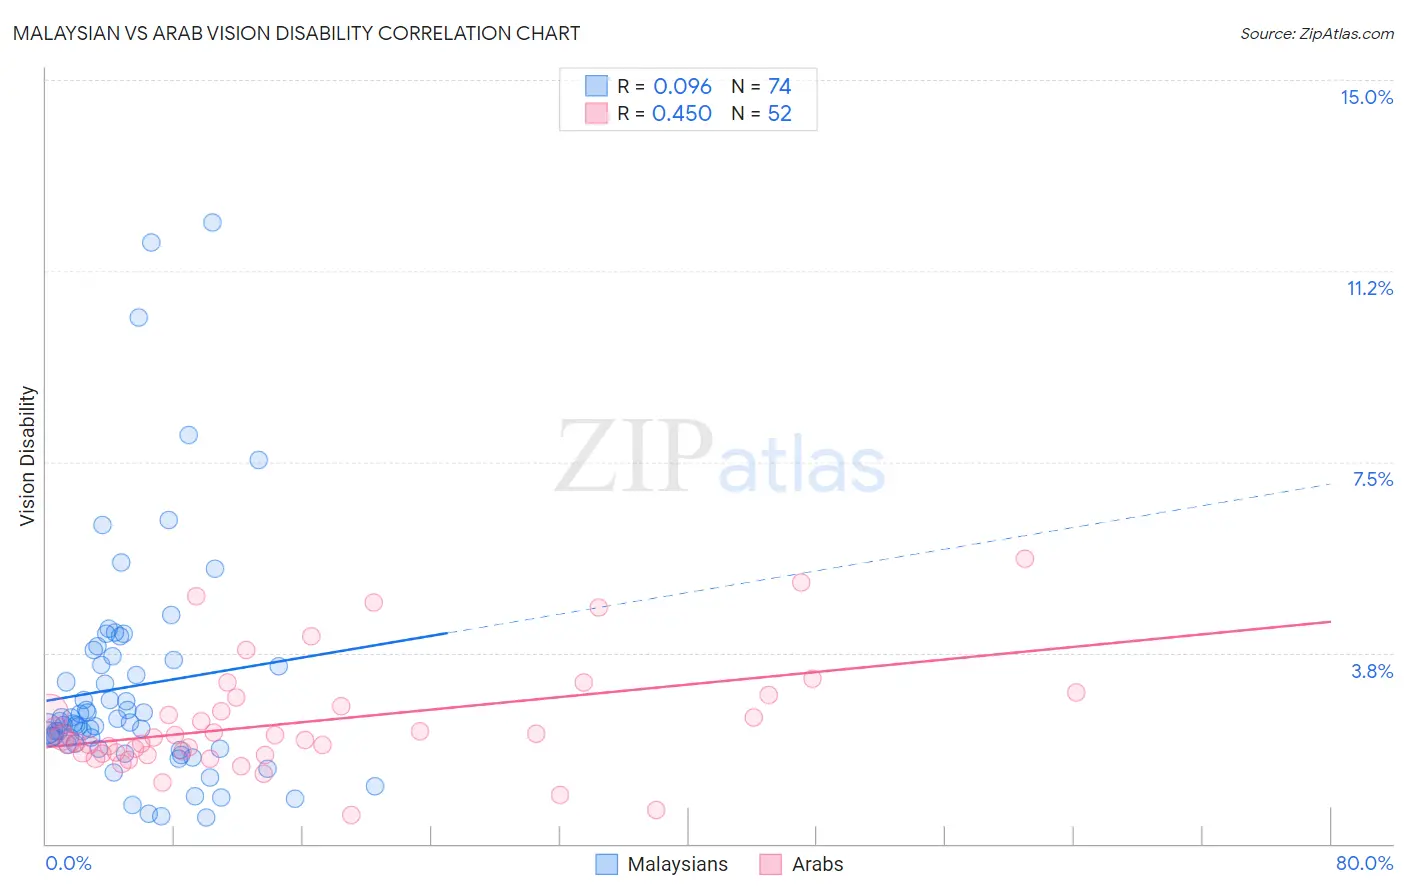
Malaysian vs Arab Vision Disability Correlation Chart
The statistical analysis conducted on geographies consisting of 226,017,600 people shows a slight positive correlation between the proportion of Malaysians and percentage of population with vision disability in the United States with a correlation coefficient (R) of 0.096 and weighted average of 2.3%. Similarly, the statistical analysis conducted on geographies consisting of 486,276,128 people shows a moderate positive correlation between the proportion of Arabs and percentage of population with vision disability in the United States with a correlation coefficient (R) of 0.450 and weighted average of 2.1%, a difference of 10.6%.
Vision Disability Correlation Summary
| Measurement | Malaysian | Arab |
| Minimum | 0.52% | 0.55% |
| Maximum | 12.2% | 5.6% |
| Range | 11.7% | 5.1% |
| Mean | 3.1% | 2.4% |
| Median | 2.4% | 2.1% |
| Interquartile 25% (IQ1) | 2.0% | 1.8% |
| Interquartile 75% (IQ3) | 3.6% | 2.8% |
| Interquartile Range (IQR) | 1.6% | 1.0% |
| Standard Deviation (Sample) | 2.3% | 1.1% |
| Standard Deviation (Population) | 2.3% | 1.1% |
Similar Demographics by Vision Disability
Demographics Similar to Malaysians by Vision Disability
In terms of vision disability, the demographic groups most similar to Malaysians are Panamanian (2.3%, a difference of 0.030%), Immigrants from Panama (2.3%, a difference of 0.14%), English (2.3%, a difference of 0.29%), Immigrants from Cambodia (2.3%, a difference of 0.30%), and Immigrants from Portugal (2.3%, a difference of 0.57%).
| Demographics | Rating | Rank | Vision Disability |
| Scottish | 1.6 /100 | #234 | Tragic 2.3% |
| Marshallese | 1.5 /100 | #235 | Tragic 2.3% |
| Immigrants | Congo | 1.4 /100 | #236 | Tragic 2.3% |
| Immigrants | Portugal | 1.4 /100 | #237 | Tragic 2.3% |
| Immigrants | Cambodia | 1.1 /100 | #238 | Tragic 2.3% |
| English | 1.1 /100 | #239 | Tragic 2.3% |
| Panamanians | 0.9 /100 | #240 | Tragic 2.3% |
| Malaysians | 0.9 /100 | #241 | Tragic 2.3% |
| Immigrants | Panama | 0.8 /100 | #242 | Tragic 2.3% |
| Immigrants | Nicaragua | 0.6 /100 | #243 | Tragic 2.3% |
| Immigrants | West Indies | 0.6 /100 | #244 | Tragic 2.3% |
| Alsatians | 0.6 /100 | #245 | Tragic 2.3% |
| French | 0.5 /100 | #246 | Tragic 2.3% |
| Guatemalans | 0.5 /100 | #247 | Tragic 2.3% |
| Sub-Saharan Africans | 0.5 /100 | #248 | Tragic 2.3% |
Demographics Similar to Arabs by Vision Disability
In terms of vision disability, the demographic groups most similar to Arabs are Czech (2.1%, a difference of 0.010%), Immigrants from South Eastern Asia (2.1%, a difference of 0.010%), Vietnamese (2.1%, a difference of 0.060%), Venezuelan (2.1%, a difference of 0.13%), and Immigrants from Morocco (2.1%, a difference of 0.14%).
| Demographics | Rating | Rank | Vision Disability |
| Immigrants | Hungary | 88.7 /100 | #131 | Excellent 2.1% |
| New Zealanders | 88.2 /100 | #132 | Excellent 2.1% |
| Syrians | 87.5 /100 | #133 | Excellent 2.1% |
| Venezuelans | 87.2 /100 | #134 | Excellent 2.1% |
| Vietnamese | 86.7 /100 | #135 | Excellent 2.1% |
| Czechs | 86.3 /100 | #136 | Excellent 2.1% |
| Immigrants | South Eastern Asia | 86.3 /100 | #137 | Excellent 2.1% |
| Arabs | 86.3 /100 | #138 | Excellent 2.1% |
| Immigrants | Morocco | 85.2 /100 | #139 | Excellent 2.1% |
| Immigrants | Netherlands | 84.2 /100 | #140 | Excellent 2.1% |
| Sierra Leoneans | 84.1 /100 | #141 | Excellent 2.1% |
| South Americans | 82.8 /100 | #142 | Excellent 2.1% |
| Immigrants | Sierra Leone | 82.8 /100 | #143 | Excellent 2.1% |
| Ukrainians | 81.9 /100 | #144 | Excellent 2.1% |
| Immigrants | Bosnia and Herzegovina | 81.5 /100 | #145 | Excellent 2.1% |