Immigrants from Taiwan vs Arab Median Female Earnings
COMPARE
Immigrants from Taiwan
Arab
Median Female Earnings
Median Female Earnings Comparison
Immigrants from Taiwan
Arabs
$49,256
MEDIAN FEMALE EARNINGS
100.0/ 100
METRIC RATING
3rd/ 347
METRIC RANK
$40,718
MEDIAN FEMALE EARNINGS
89.3/ 100
METRIC RATING
134th/ 347
METRIC RANK
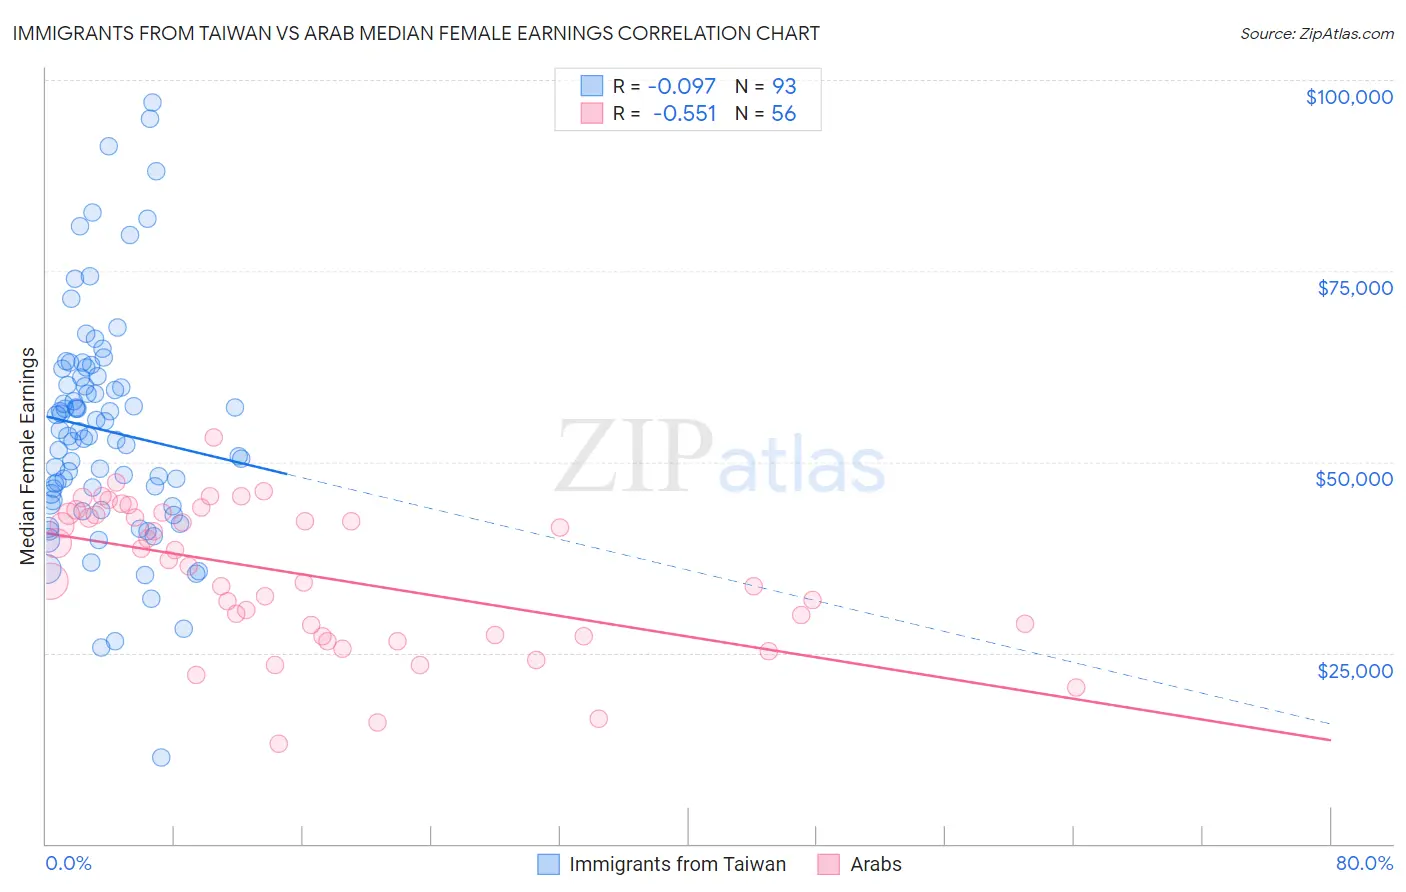
Immigrants from Taiwan vs Arab Median Female Earnings Correlation Chart
The statistical analysis conducted on geographies consisting of 298,206,550 people shows a slight negative correlation between the proportion of Immigrants from Taiwan and median female earnings in the United States with a correlation coefficient (R) of -0.097 and weighted average of $49,256. Similarly, the statistical analysis conducted on geographies consisting of 486,538,152 people shows a substantial negative correlation between the proportion of Arabs and median female earnings in the United States with a correlation coefficient (R) of -0.551 and weighted average of $40,718, a difference of 21.0%.
Median Female Earnings Correlation Summary
| Measurement | Immigrants from Taiwan | Arab |
| Minimum | $11,250 | $13,173 |
| Maximum | $97,064 | $53,122 |
| Range | $85,814 | $39,949 |
| Mean | $54,143 | $35,183 |
| Median | $53,398 | $36,815 |
| Interquartile 25% (IQ1) | $44,696 | $27,287 |
| Interquartile 75% (IQ3) | $61,160 | $43,150 |
| Interquartile Range (IQR) | $16,465 | $15,863 |
| Standard Deviation (Sample) | $14,938 | $9,334 |
| Standard Deviation (Population) | $14,857 | $9,250 |
Similar Demographics by Median Female Earnings
Demographics Similar to Immigrants from Taiwan by Median Female Earnings
In terms of median female earnings, the demographic groups most similar to Immigrants from Taiwan are Filipino ($49,508, a difference of 0.51%), Immigrants from Hong Kong ($49,818, a difference of 1.1%), Immigrants from India ($48,292, a difference of 2.0%), Immigrants from Singapore ($47,986, a difference of 2.6%), and Immigrants from Ireland ($47,598, a difference of 3.5%).
| Demographics | Rating | Rank | Median Female Earnings |
| Immigrants | Hong Kong | 100.0 /100 | #1 | Exceptional $49,818 |
| Filipinos | 100.0 /100 | #2 | Exceptional $49,508 |
| Immigrants | Taiwan | 100.0 /100 | #3 | Exceptional $49,256 |
| Immigrants | India | 100.0 /100 | #4 | Exceptional $48,292 |
| Immigrants | Singapore | 100.0 /100 | #5 | Exceptional $47,986 |
| Immigrants | Ireland | 100.0 /100 | #6 | Exceptional $47,598 |
| Thais | 100.0 /100 | #7 | Exceptional $47,577 |
| Iranians | 100.0 /100 | #8 | Exceptional $47,421 |
| Immigrants | Iran | 100.0 /100 | #9 | Exceptional $47,154 |
| Immigrants | China | 100.0 /100 | #10 | Exceptional $46,972 |
| Okinawans | 100.0 /100 | #11 | Exceptional $46,905 |
| Immigrants | Israel | 100.0 /100 | #12 | Exceptional $46,902 |
| Immigrants | Australia | 100.0 /100 | #13 | Exceptional $46,573 |
| Soviet Union | 100.0 /100 | #14 | Exceptional $46,556 |
| Immigrants | Eastern Asia | 100.0 /100 | #15 | Exceptional $46,502 |
Demographics Similar to Arabs by Median Female Earnings
In terms of median female earnings, the demographic groups most similar to Arabs are Syrian ($40,727, a difference of 0.020%), Immigrants from Nepal ($40,704, a difference of 0.030%), Immigrants from Uganda ($40,739, a difference of 0.050%), Chilean ($40,757, a difference of 0.10%), and Immigrants from Guyana ($40,773, a difference of 0.14%).
| Demographics | Rating | Rank | Median Female Earnings |
| Ugandans | 92.2 /100 | #127 | Exceptional $40,889 |
| Carpatho Rusyns | 91.2 /100 | #128 | Exceptional $40,825 |
| Zimbabweans | 90.8 /100 | #129 | Exceptional $40,798 |
| Immigrants | Guyana | 90.3 /100 | #130 | Exceptional $40,773 |
| Chileans | 90.0 /100 | #131 | Exceptional $40,757 |
| Immigrants | Uganda | 89.7 /100 | #132 | Excellent $40,739 |
| Syrians | 89.5 /100 | #133 | Excellent $40,727 |
| Arabs | 89.3 /100 | #134 | Excellent $40,718 |
| Immigrants | Nepal | 89.0 /100 | #135 | Excellent $40,704 |
| Immigrants | Eastern Africa | 87.7 /100 | #136 | Excellent $40,644 |
| Pakistanis | 86.6 /100 | #137 | Excellent $40,596 |
| Taiwanese | 86.1 /100 | #138 | Excellent $40,576 |
| Immigrants | South Eastern Asia | 85.7 /100 | #139 | Excellent $40,558 |
| Serbians | 85.2 /100 | #140 | Excellent $40,539 |
| Immigrants | Syria | 84.1 /100 | #141 | Excellent $40,499 |