Macedonian vs Laotian Median Family Income
COMPARE
Macedonian
Laotian
Median Family Income
Median Family Income Comparison
Macedonians
Laotians
$109,668
MEDIAN FAMILY INCOME
97.3/ 100
METRIC RATING
100th/ 347
METRIC RANK
$112,859
MEDIAN FAMILY INCOME
99.5/ 100
METRIC RATING
73rd/ 347
METRIC RANK
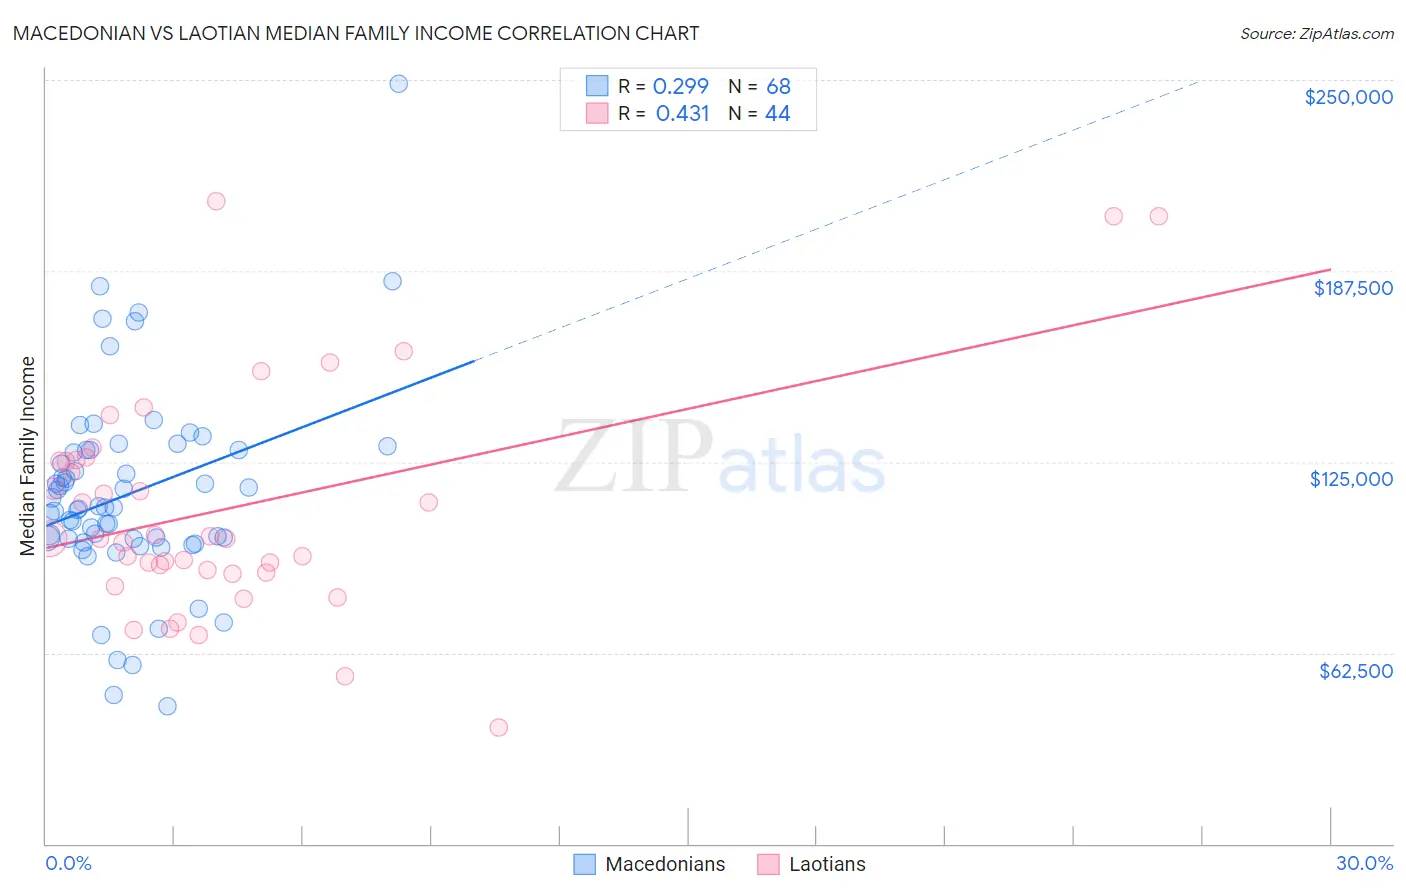
Macedonian vs Laotian Median Family Income Correlation Chart
The statistical analysis conducted on geographies consisting of 132,508,539 people shows a weak positive correlation between the proportion of Macedonians and median family income in the United States with a correlation coefficient (R) of 0.299 and weighted average of $109,668. Similarly, the statistical analysis conducted on geographies consisting of 224,714,380 people shows a moderate positive correlation between the proportion of Laotians and median family income in the United States with a correlation coefficient (R) of 0.431 and weighted average of $112,859, a difference of 2.9%.
Median Family Income Correlation Summary
| Measurement | Macedonian | Laotian |
| Minimum | $44,804 | $38,056 |
| Maximum | $248,750 | $210,375 |
| Range | $203,946 | $172,319 |
| Mean | $114,576 | $109,887 |
| Median | $110,196 | $99,824 |
| Interquartile 25% (IQ1) | $99,876 | $89,104 |
| Interquartile 75% (IQ3) | $128,750 | $125,414 |
| Interquartile Range (IQR) | $28,874 | $36,309 |
| Standard Deviation (Sample) | $32,654 | $37,256 |
| Standard Deviation (Population) | $32,413 | $36,830 |
Similar Demographics by Median Family Income
Demographics Similar to Macedonians by Median Family Income
In terms of median family income, the demographic groups most similar to Macedonians are Armenian ($109,692, a difference of 0.020%), Immigrants from Ukraine ($109,645, a difference of 0.020%), Assyrian/Chaldean/Syriac ($109,622, a difference of 0.040%), Immigrants from Kuwait ($109,731, a difference of 0.060%), and Jordanian ($109,865, a difference of 0.18%).
| Demographics | Rating | Rank | Median Family Income |
| Immigrants | Kazakhstan | 97.8 /100 | #93 | Exceptional $110,137 |
| Koreans | 97.8 /100 | #94 | Exceptional $110,103 |
| Zimbabweans | 97.7 /100 | #95 | Exceptional $110,011 |
| Immigrants | Moldova | 97.7 /100 | #96 | Exceptional $109,975 |
| Jordanians | 97.5 /100 | #97 | Exceptional $109,865 |
| Immigrants | Kuwait | 97.4 /100 | #98 | Exceptional $109,731 |
| Armenians | 97.3 /100 | #99 | Exceptional $109,692 |
| Macedonians | 97.3 /100 | #100 | Exceptional $109,668 |
| Immigrants | Ukraine | 97.2 /100 | #101 | Exceptional $109,645 |
| Assyrians/Chaldeans/Syriacs | 97.2 /100 | #102 | Exceptional $109,622 |
| Immigrants | Brazil | 96.9 /100 | #103 | Exceptional $109,418 |
| Palestinians | 96.9 /100 | #104 | Exceptional $109,413 |
| Syrians | 96.7 /100 | #105 | Exceptional $109,299 |
| Albanians | 96.4 /100 | #106 | Exceptional $109,136 |
| Immigrants | North Macedonia | 96.4 /100 | #107 | Exceptional $109,136 |
Demographics Similar to Laotians by Median Family Income
In terms of median family income, the demographic groups most similar to Laotians are Immigrants from Italy ($112,848, a difference of 0.010%), Afghan ($112,971, a difference of 0.10%), Immigrants from Western Europe ($112,688, a difference of 0.15%), Argentinean ($112,665, a difference of 0.17%), and Immigrants from Eastern Europe ($112,527, a difference of 0.30%).
| Demographics | Rating | Rank | Median Family Income |
| Paraguayans | 99.7 /100 | #66 | Exceptional $114,016 |
| Immigrants | Spain | 99.7 /100 | #67 | Exceptional $113,815 |
| Immigrants | Serbia | 99.6 /100 | #68 | Exceptional $113,463 |
| Immigrants | Bulgaria | 99.6 /100 | #69 | Exceptional $113,461 |
| Immigrants | Romania | 99.6 /100 | #70 | Exceptional $113,434 |
| South Africans | 99.5 /100 | #71 | Exceptional $113,229 |
| Afghans | 99.5 /100 | #72 | Exceptional $112,971 |
| Laotians | 99.5 /100 | #73 | Exceptional $112,859 |
| Immigrants | Italy | 99.4 /100 | #74 | Exceptional $112,848 |
| Immigrants | Western Europe | 99.4 /100 | #75 | Exceptional $112,688 |
| Argentineans | 99.4 /100 | #76 | Exceptional $112,665 |
| Immigrants | Eastern Europe | 99.4 /100 | #77 | Exceptional $112,527 |
| Immigrants | Canada | 99.3 /100 | #78 | Exceptional $112,374 |
| Italians | 99.3 /100 | #79 | Exceptional $112,372 |
| Immigrants | Croatia | 99.3 /100 | #80 | Exceptional $112,323 |