Immigrants from Yemen vs Laotian Median Family Income
COMPARE
Immigrants from Yemen
Laotian
Median Family Income
Median Family Income Comparison
Immigrants from Yemen
Laotians
$77,457
MEDIAN FAMILY INCOME
0.0/ 100
METRIC RATING
338th/ 347
METRIC RANK
$112,859
MEDIAN FAMILY INCOME
99.5/ 100
METRIC RATING
73rd/ 347
METRIC RANK
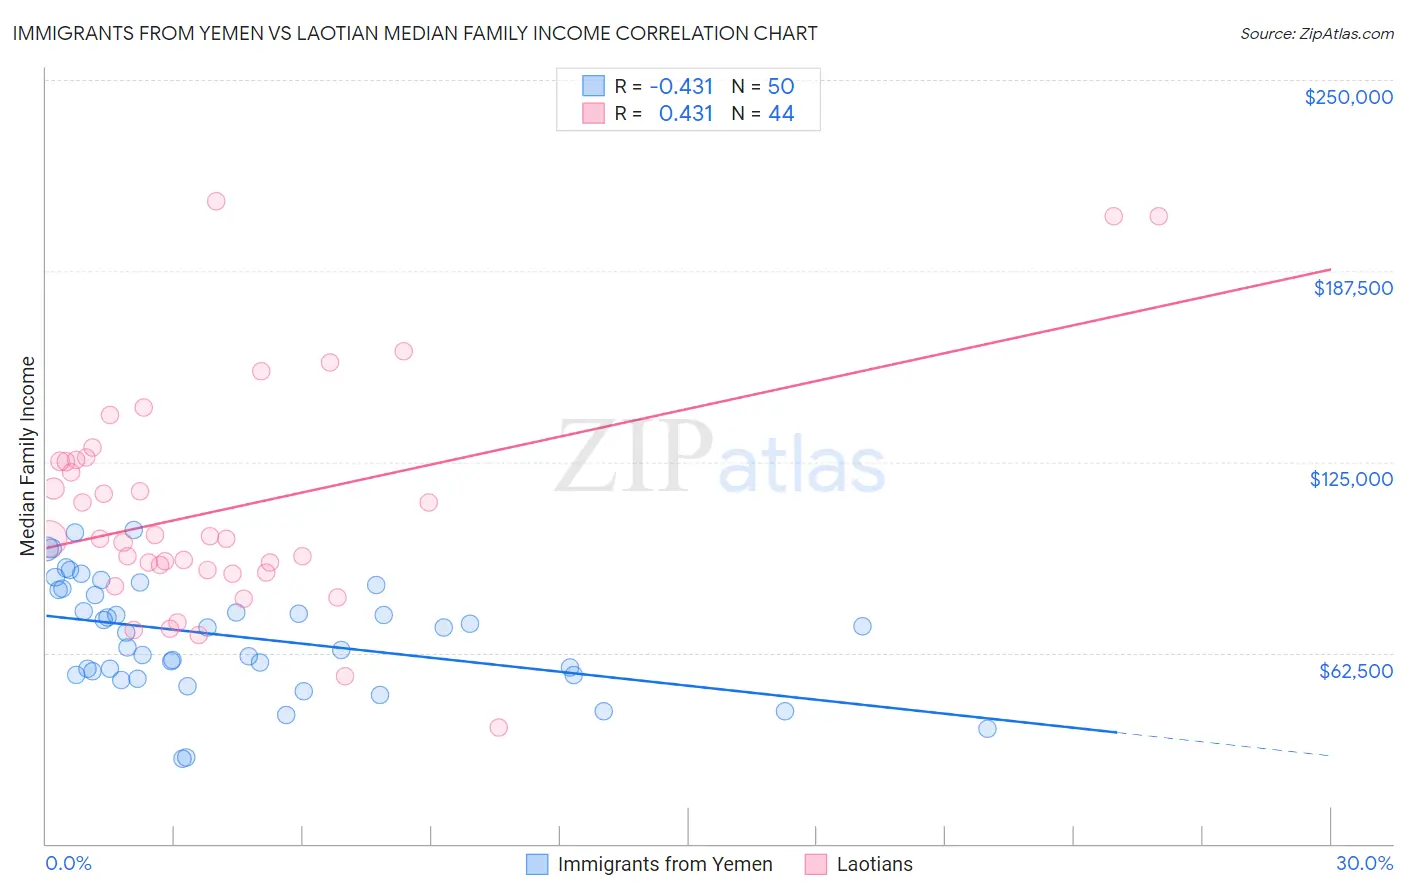
Immigrants from Yemen vs Laotian Median Family Income Correlation Chart
The statistical analysis conducted on geographies consisting of 82,428,654 people shows a moderate negative correlation between the proportion of Immigrants from Yemen and median family income in the United States with a correlation coefficient (R) of -0.431 and weighted average of $77,457. Similarly, the statistical analysis conducted on geographies consisting of 224,714,380 people shows a moderate positive correlation between the proportion of Laotians and median family income in the United States with a correlation coefficient (R) of 0.431 and weighted average of $112,859, a difference of 45.7%.
Median Family Income Correlation Summary
| Measurement | Immigrants from Yemen | Laotian |
| Minimum | $28,000 | $38,056 |
| Maximum | $102,670 | $210,375 |
| Range | $74,670 | $172,319 |
| Mean | $67,712 | $109,887 |
| Median | $69,869 | $99,824 |
| Interquartile 25% (IQ1) | $55,430 | $89,104 |
| Interquartile 75% (IQ3) | $83,169 | $125,414 |
| Interquartile Range (IQR) | $27,739 | $36,309 |
| Standard Deviation (Sample) | $18,166 | $37,256 |
| Standard Deviation (Population) | $17,984 | $36,830 |
Similar Demographics by Median Family Income
Demographics Similar to Immigrants from Yemen by Median Family Income
In terms of median family income, the demographic groups most similar to Immigrants from Yemen are Pima ($77,431, a difference of 0.030%), Hopi ($77,188, a difference of 0.35%), Pueblo ($76,880, a difference of 0.75%), Yuman ($78,055, a difference of 0.77%), and Immigrants from Cuba ($78,249, a difference of 1.0%).
| Demographics | Rating | Rank | Median Family Income |
| Immigrants | Dominican Republic | 0.0 /100 | #331 | Tragic $81,233 |
| Natives/Alaskans | 0.0 /100 | #332 | Tragic $80,908 |
| Kiowa | 0.0 /100 | #333 | Tragic $80,885 |
| Menominee | 0.0 /100 | #334 | Tragic $79,563 |
| Yup'ik | 0.0 /100 | #335 | Tragic $79,290 |
| Immigrants | Cuba | 0.0 /100 | #336 | Tragic $78,249 |
| Yuman | 0.0 /100 | #337 | Tragic $78,055 |
| Immigrants | Yemen | 0.0 /100 | #338 | Tragic $77,457 |
| Pima | 0.0 /100 | #339 | Tragic $77,431 |
| Hopi | 0.0 /100 | #340 | Tragic $77,188 |
| Pueblo | 0.0 /100 | #341 | Tragic $76,880 |
| Crow | 0.0 /100 | #342 | Tragic $76,605 |
| Houma | 0.0 /100 | #343 | Tragic $76,188 |
| Tohono O'odham | 0.0 /100 | #344 | Tragic $72,193 |
| Navajo | 0.0 /100 | #345 | Tragic $70,989 |
Demographics Similar to Laotians by Median Family Income
In terms of median family income, the demographic groups most similar to Laotians are Immigrants from Italy ($112,848, a difference of 0.010%), Afghan ($112,971, a difference of 0.10%), Immigrants from Western Europe ($112,688, a difference of 0.15%), Argentinean ($112,665, a difference of 0.17%), and Immigrants from Eastern Europe ($112,527, a difference of 0.30%).
| Demographics | Rating | Rank | Median Family Income |
| Paraguayans | 99.7 /100 | #66 | Exceptional $114,016 |
| Immigrants | Spain | 99.7 /100 | #67 | Exceptional $113,815 |
| Immigrants | Serbia | 99.6 /100 | #68 | Exceptional $113,463 |
| Immigrants | Bulgaria | 99.6 /100 | #69 | Exceptional $113,461 |
| Immigrants | Romania | 99.6 /100 | #70 | Exceptional $113,434 |
| South Africans | 99.5 /100 | #71 | Exceptional $113,229 |
| Afghans | 99.5 /100 | #72 | Exceptional $112,971 |
| Laotians | 99.5 /100 | #73 | Exceptional $112,859 |
| Immigrants | Italy | 99.4 /100 | #74 | Exceptional $112,848 |
| Immigrants | Western Europe | 99.4 /100 | #75 | Exceptional $112,688 |
| Argentineans | 99.4 /100 | #76 | Exceptional $112,665 |
| Immigrants | Eastern Europe | 99.4 /100 | #77 | Exceptional $112,527 |
| Immigrants | Canada | 99.3 /100 | #78 | Exceptional $112,374 |
| Italians | 99.3 /100 | #79 | Exceptional $112,372 |
| Immigrants | Croatia | 99.3 /100 | #80 | Exceptional $112,323 |