Macedonian vs Laotian 9th Grade
COMPARE
Macedonian
Laotian
9th Grade
9th Grade Comparison
Macedonians
Laotians
96.0%
9TH GRADE
99.8/ 100
METRIC RATING
57th/ 347
METRIC RANK
94.6%
9TH GRADE
21.0/ 100
METRIC RATING
199th/ 347
METRIC RANK
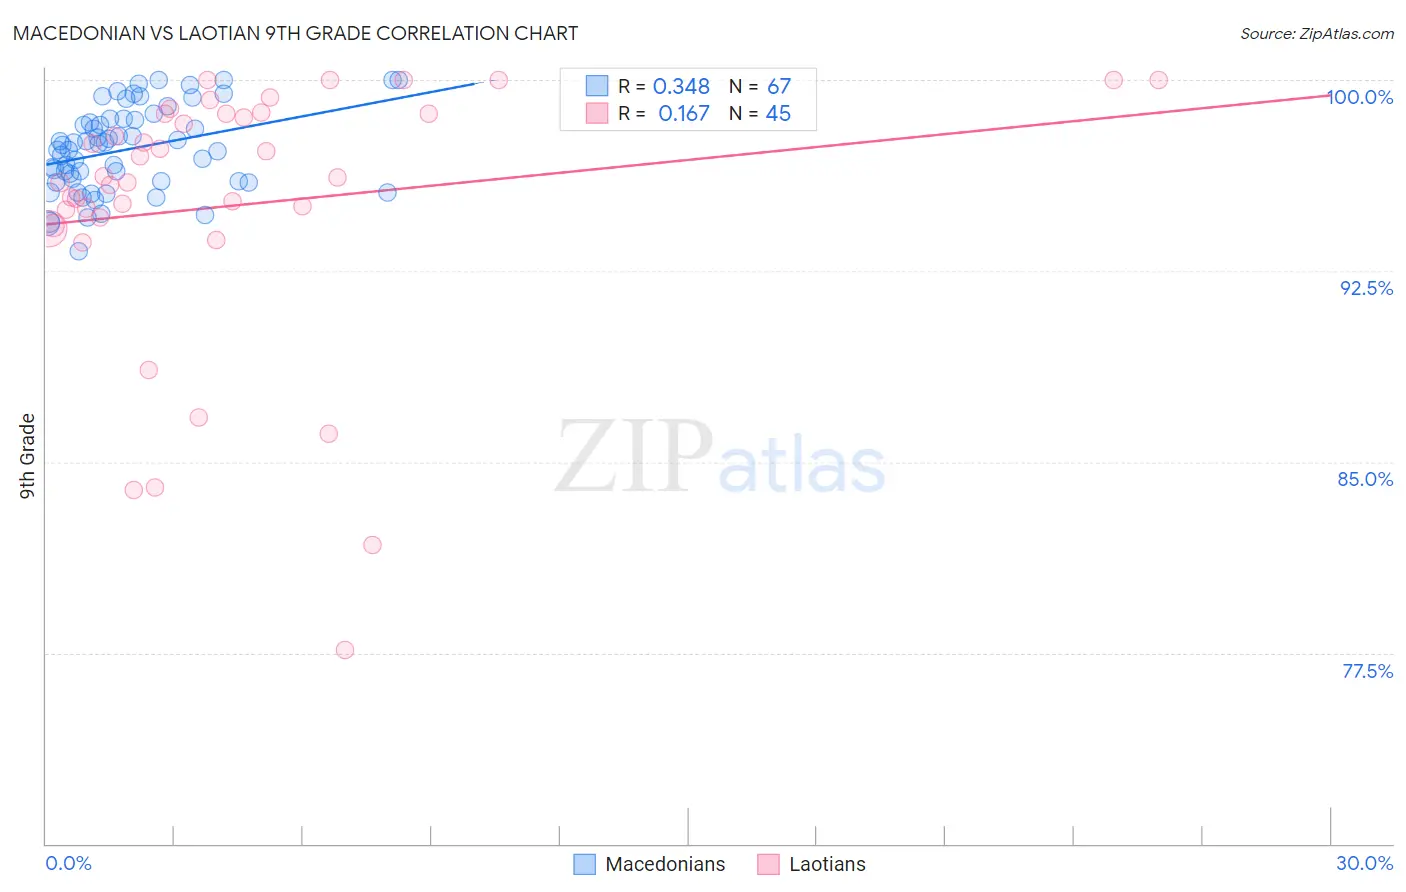
Macedonian vs Laotian 9th Grade Correlation Chart
The statistical analysis conducted on geographies consisting of 132,581,663 people shows a mild positive correlation between the proportion of Macedonians and percentage of population with at least 9th grade education in the United States with a correlation coefficient (R) of 0.348 and weighted average of 96.0%. Similarly, the statistical analysis conducted on geographies consisting of 224,856,886 people shows a poor positive correlation between the proportion of Laotians and percentage of population with at least 9th grade education in the United States with a correlation coefficient (R) of 0.167 and weighted average of 94.6%, a difference of 1.4%.
9th Grade Correlation Summary
| Measurement | Macedonian | Laotian |
| Minimum | 93.3% | 77.6% |
| Maximum | 100.0% | 100.0% |
| Range | 6.7% | 22.4% |
| Mean | 97.3% | 95.1% |
| Median | 97.5% | 96.2% |
| Interquartile 25% (IQ1) | 96.0% | 94.4% |
| Interquartile 75% (IQ3) | 98.5% | 98.7% |
| Interquartile Range (IQR) | 2.5% | 4.2% |
| Standard Deviation (Sample) | 1.7% | 5.3% |
| Standard Deviation (Population) | 1.6% | 5.2% |
Similar Demographics by 9th Grade
Demographics Similar to Macedonians by 9th Grade
In terms of 9th grade, the demographic groups most similar to Macedonians are Aleut (96.0%, a difference of 0.0%), Immigrants from Austria (96.0%, a difference of 0.010%), Immigrants from North America (96.0%, a difference of 0.010%), New Zealander (95.9%, a difference of 0.020%), and Immigrants from Canada (96.0%, a difference of 0.030%).
| Demographics | Rating | Rank | 9th Grade |
| Celtics | 99.9 /100 | #50 | Exceptional 96.0% |
| Immigrants | Northern Europe | 99.9 /100 | #51 | Exceptional 96.0% |
| Serbians | 99.9 /100 | #52 | Exceptional 96.0% |
| Austrians | 99.8 /100 | #53 | Exceptional 96.0% |
| Immigrants | Canada | 99.8 /100 | #54 | Exceptional 96.0% |
| Immigrants | Austria | 99.8 /100 | #55 | Exceptional 96.0% |
| Immigrants | North America | 99.8 /100 | #56 | Exceptional 96.0% |
| Macedonians | 99.8 /100 | #57 | Exceptional 96.0% |
| Aleuts | 99.8 /100 | #58 | Exceptional 96.0% |
| New Zealanders | 99.8 /100 | #59 | Exceptional 95.9% |
| Native Hawaiians | 99.8 /100 | #60 | Exceptional 95.9% |
| Sioux | 99.8 /100 | #61 | Exceptional 95.9% |
| Ukrainians | 99.7 /100 | #62 | Exceptional 95.9% |
| Canadians | 99.7 /100 | #63 | Exceptional 95.9% |
| Zimbabweans | 99.7 /100 | #64 | Exceptional 95.9% |
Demographics Similar to Laotians by 9th Grade
In terms of 9th grade, the demographic groups most similar to Laotians are Immigrants from Zaire (94.6%, a difference of 0.0%), Black/African American (94.6%, a difference of 0.010%), Immigrants from Eastern Asia (94.6%, a difference of 0.010%), Immigrants from Bahamas (94.6%, a difference of 0.010%), and Hawaiian (94.7%, a difference of 0.020%).
| Demographics | Rating | Rank | 9th Grade |
| Immigrants | Northern Africa | 30.7 /100 | #192 | Fair 94.7% |
| Paraguayans | 30.1 /100 | #193 | Fair 94.7% |
| Panamanians | 29.0 /100 | #194 | Fair 94.7% |
| Marshallese | 27.9 /100 | #195 | Fair 94.7% |
| Immigrants | Lebanon | 27.2 /100 | #196 | Fair 94.7% |
| Immigrants | Micronesia | 24.7 /100 | #197 | Fair 94.7% |
| Hawaiians | 22.7 /100 | #198 | Fair 94.7% |
| Laotians | 21.0 /100 | #199 | Fair 94.6% |
| Immigrants | Zaire | 20.6 /100 | #200 | Fair 94.6% |
| Blacks/African Americans | 20.5 /100 | #201 | Fair 94.6% |
| Immigrants | Eastern Asia | 19.8 /100 | #202 | Poor 94.6% |
| Immigrants | Bahamas | 19.8 /100 | #203 | Poor 94.6% |
| Moroccans | 19.6 /100 | #204 | Poor 94.6% |
| Immigrants | Sudan | 17.6 /100 | #205 | Poor 94.6% |
| Samoans | 17.3 /100 | #206 | Poor 94.6% |