Russian vs Laotian Median Family Income
COMPARE
Russian
Laotian
Median Family Income
Median Family Income Comparison
Russians
Laotians
$120,487
MEDIAN FAMILY INCOME
100.0/ 100
METRIC RATING
27th/ 347
METRIC RANK
$112,859
MEDIAN FAMILY INCOME
99.5/ 100
METRIC RATING
73rd/ 347
METRIC RANK
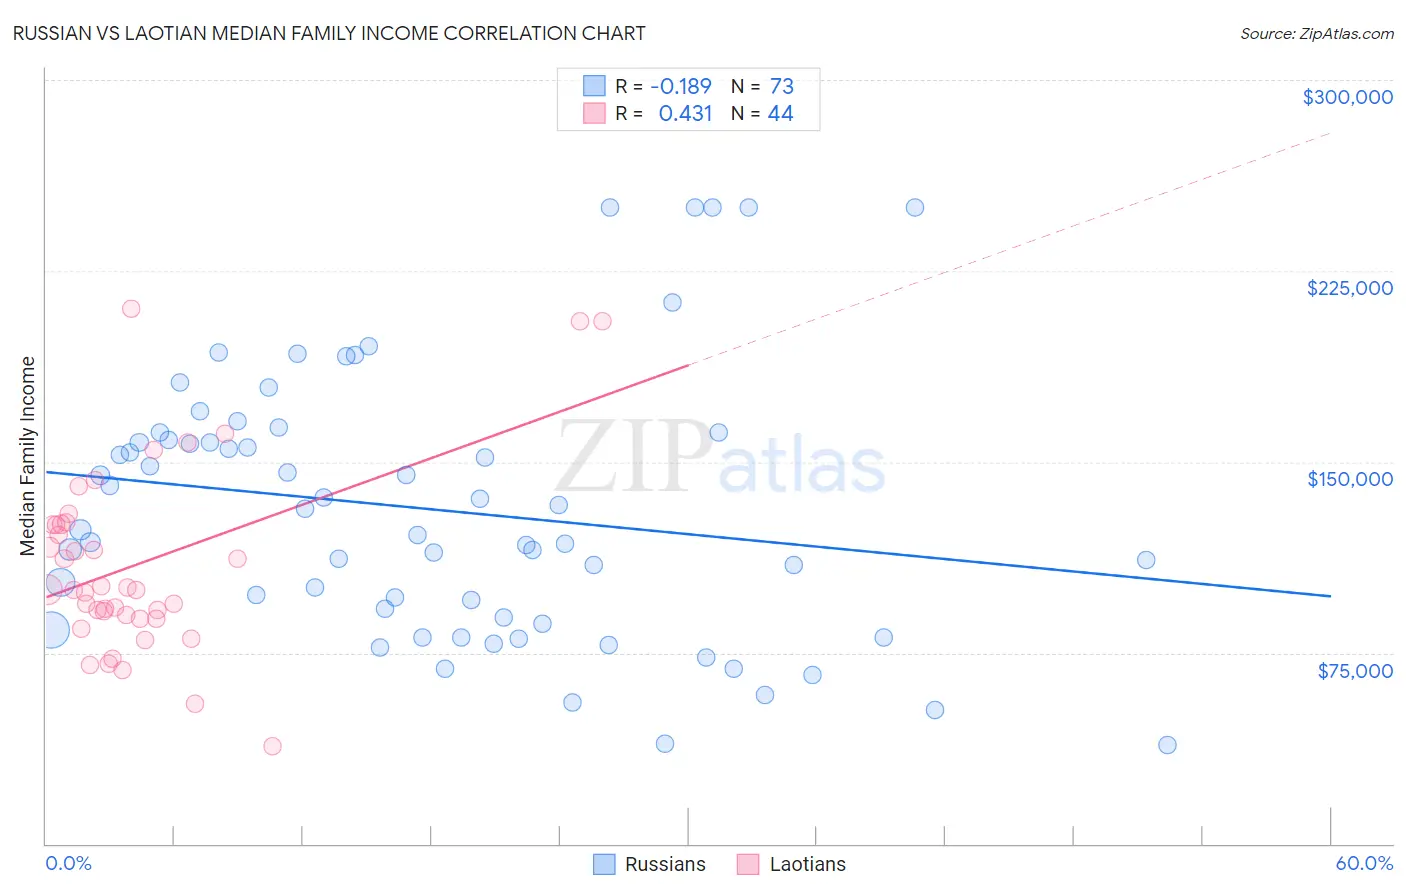
Russian vs Laotian Median Family Income Correlation Chart
The statistical analysis conducted on geographies consisting of 511,404,289 people shows a poor negative correlation between the proportion of Russians and median family income in the United States with a correlation coefficient (R) of -0.189 and weighted average of $120,487. Similarly, the statistical analysis conducted on geographies consisting of 224,714,380 people shows a moderate positive correlation between the proportion of Laotians and median family income in the United States with a correlation coefficient (R) of 0.431 and weighted average of $112,859, a difference of 6.8%.
Median Family Income Correlation Summary
| Measurement | Russian | Laotian |
| Minimum | $38,939 | $38,056 |
| Maximum | $250,001 | $210,375 |
| Range | $211,062 | $172,319 |
| Mean | $131,214 | $109,887 |
| Median | $123,457 | $99,824 |
| Interquartile 25% (IQ1) | $87,492 | $89,104 |
| Interquartile 75% (IQ3) | $160,004 | $125,414 |
| Interquartile Range (IQR) | $72,512 | $36,309 |
| Standard Deviation (Sample) | $52,364 | $37,256 |
| Standard Deviation (Population) | $52,005 | $36,830 |
Similar Demographics by Median Family Income
Demographics Similar to Russians by Median Family Income
In terms of median family income, the demographic groups most similar to Russians are Immigrants from Denmark ($120,445, a difference of 0.040%), Latvian ($120,301, a difference of 0.15%), Immigrants from Sri Lanka ($120,263, a difference of 0.19%), Immigrants from Switzerland ($120,726, a difference of 0.20%), and Immigrants from France ($120,076, a difference of 0.34%).
| Demographics | Rating | Rank | Median Family Income |
| Burmese | 100.0 /100 | #20 | Exceptional $123,369 |
| Immigrants | Korea | 100.0 /100 | #21 | Exceptional $122,800 |
| Immigrants | Sweden | 100.0 /100 | #22 | Exceptional $122,765 |
| Immigrants | Japan | 100.0 /100 | #23 | Exceptional $122,764 |
| Immigrants | Northern Europe | 100.0 /100 | #24 | Exceptional $121,840 |
| Turks | 100.0 /100 | #25 | Exceptional $121,202 |
| Immigrants | Switzerland | 100.0 /100 | #26 | Exceptional $120,726 |
| Russians | 100.0 /100 | #27 | Exceptional $120,487 |
| Immigrants | Denmark | 100.0 /100 | #28 | Exceptional $120,445 |
| Latvians | 100.0 /100 | #29 | Exceptional $120,301 |
| Immigrants | Sri Lanka | 100.0 /100 | #30 | Exceptional $120,263 |
| Immigrants | France | 100.0 /100 | #31 | Exceptional $120,076 |
| Asians | 100.0 /100 | #32 | Exceptional $119,955 |
| Bhutanese | 100.0 /100 | #33 | Exceptional $119,800 |
| Bolivians | 100.0 /100 | #34 | Exceptional $119,479 |
Demographics Similar to Laotians by Median Family Income
In terms of median family income, the demographic groups most similar to Laotians are Immigrants from Italy ($112,848, a difference of 0.010%), Afghan ($112,971, a difference of 0.10%), Immigrants from Western Europe ($112,688, a difference of 0.15%), Argentinean ($112,665, a difference of 0.17%), and Immigrants from Eastern Europe ($112,527, a difference of 0.30%).
| Demographics | Rating | Rank | Median Family Income |
| Paraguayans | 99.7 /100 | #66 | Exceptional $114,016 |
| Immigrants | Spain | 99.7 /100 | #67 | Exceptional $113,815 |
| Immigrants | Serbia | 99.6 /100 | #68 | Exceptional $113,463 |
| Immigrants | Bulgaria | 99.6 /100 | #69 | Exceptional $113,461 |
| Immigrants | Romania | 99.6 /100 | #70 | Exceptional $113,434 |
| South Africans | 99.5 /100 | #71 | Exceptional $113,229 |
| Afghans | 99.5 /100 | #72 | Exceptional $112,971 |
| Laotians | 99.5 /100 | #73 | Exceptional $112,859 |
| Immigrants | Italy | 99.4 /100 | #74 | Exceptional $112,848 |
| Immigrants | Western Europe | 99.4 /100 | #75 | Exceptional $112,688 |
| Argentineans | 99.4 /100 | #76 | Exceptional $112,665 |
| Immigrants | Eastern Europe | 99.4 /100 | #77 | Exceptional $112,527 |
| Immigrants | Canada | 99.3 /100 | #78 | Exceptional $112,374 |
| Italians | 99.3 /100 | #79 | Exceptional $112,372 |
| Immigrants | Croatia | 99.3 /100 | #80 | Exceptional $112,323 |