Macedonian vs Immigrants from Kuwait Median Family Income
COMPARE
Macedonian
Immigrants from Kuwait
Median Family Income
Median Family Income Comparison
Macedonians
Immigrants from Kuwait
$109,668
MEDIAN FAMILY INCOME
97.3/ 100
METRIC RATING
100th/ 347
METRIC RANK
$109,731
MEDIAN FAMILY INCOME
97.4/ 100
METRIC RATING
98th/ 347
METRIC RANK
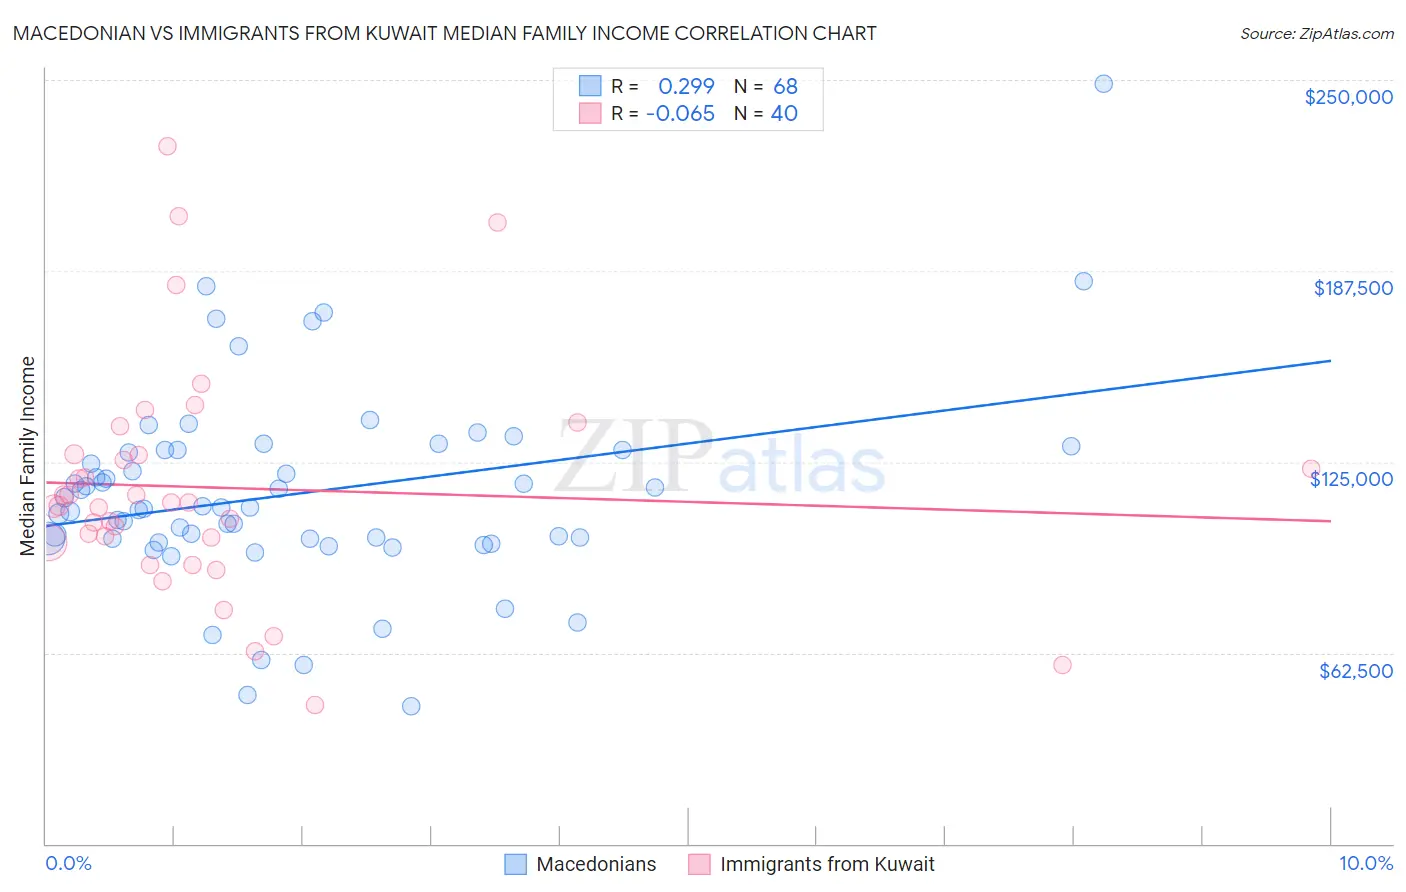
Macedonian vs Immigrants from Kuwait Median Family Income Correlation Chart
The statistical analysis conducted on geographies consisting of 132,508,539 people shows a weak positive correlation between the proportion of Macedonians and median family income in the United States with a correlation coefficient (R) of 0.299 and weighted average of $109,668. Similarly, the statistical analysis conducted on geographies consisting of 136,880,543 people shows a slight negative correlation between the proportion of Immigrants from Kuwait and median family income in the United States with a correlation coefficient (R) of -0.065 and weighted average of $109,731, a difference of 0.060%.
Median Family Income Correlation Summary
| Measurement | Macedonian | Immigrants from Kuwait |
| Minimum | $44,804 | $45,469 |
| Maximum | $248,750 | $228,438 |
| Range | $203,946 | $182,969 |
| Mean | $114,576 | $116,543 |
| Median | $110,196 | $111,085 |
| Interquartile 25% (IQ1) | $99,876 | $99,414 |
| Interquartile 75% (IQ3) | $128,750 | $127,464 |
| Interquartile Range (IQR) | $28,874 | $28,050 |
| Standard Deviation (Sample) | $32,654 | $37,905 |
| Standard Deviation (Population) | $32,413 | $37,428 |
Demographics Similar to Macedonians and Immigrants from Kuwait by Median Family Income
In terms of median family income, the demographic groups most similar to Macedonians are Armenian ($109,692, a difference of 0.020%), Immigrants from Ukraine ($109,645, a difference of 0.020%), Assyrian/Chaldean/Syriac ($109,622, a difference of 0.040%), Jordanian ($109,865, a difference of 0.18%), and Immigrants from Brazil ($109,418, a difference of 0.23%). Similarly, the demographic groups most similar to Immigrants from Kuwait are Armenian ($109,692, a difference of 0.040%), Immigrants from Ukraine ($109,645, a difference of 0.080%), Assyrian/Chaldean/Syriac ($109,622, a difference of 0.10%), Jordanian ($109,865, a difference of 0.12%), and Immigrants from Moldova ($109,975, a difference of 0.22%).
| Demographics | Rating | Rank | Median Family Income |
| Immigrants | Argentina | 98.5 /100 | #89 | Exceptional $110,873 |
| Northern Europeans | 98.3 /100 | #90 | Exceptional $110,635 |
| Immigrants | Southern Europe | 98.3 /100 | #91 | Exceptional $110,614 |
| Immigrants | Lebanon | 97.9 /100 | #92 | Exceptional $110,159 |
| Immigrants | Kazakhstan | 97.8 /100 | #93 | Exceptional $110,137 |
| Koreans | 97.8 /100 | #94 | Exceptional $110,103 |
| Zimbabweans | 97.7 /100 | #95 | Exceptional $110,011 |
| Immigrants | Moldova | 97.7 /100 | #96 | Exceptional $109,975 |
| Jordanians | 97.5 /100 | #97 | Exceptional $109,865 |
| Immigrants | Kuwait | 97.4 /100 | #98 | Exceptional $109,731 |
| Armenians | 97.3 /100 | #99 | Exceptional $109,692 |
| Macedonians | 97.3 /100 | #100 | Exceptional $109,668 |
| Immigrants | Ukraine | 97.2 /100 | #101 | Exceptional $109,645 |
| Assyrians/Chaldeans/Syriacs | 97.2 /100 | #102 | Exceptional $109,622 |
| Immigrants | Brazil | 96.9 /100 | #103 | Exceptional $109,418 |
| Palestinians | 96.9 /100 | #104 | Exceptional $109,413 |
| Syrians | 96.7 /100 | #105 | Exceptional $109,299 |
| Albanians | 96.4 /100 | #106 | Exceptional $109,136 |
| Immigrants | North Macedonia | 96.4 /100 | #107 | Exceptional $109,136 |
| Immigrants | Zimbabwe | 95.9 /100 | #108 | Exceptional $108,830 |
| Immigrants | Afghanistan | 95.6 /100 | #109 | Exceptional $108,709 |