Macedonian vs Immigrants from Congo Median Family Income
COMPARE
Macedonian
Immigrants from Congo
Median Family Income
Median Family Income Comparison
Macedonians
Immigrants from Congo
$109,668
MEDIAN FAMILY INCOME
97.3/ 100
METRIC RATING
100th/ 347
METRIC RANK
$82,216
MEDIAN FAMILY INCOME
0.0/ 100
METRIC RATING
326th/ 347
METRIC RANK
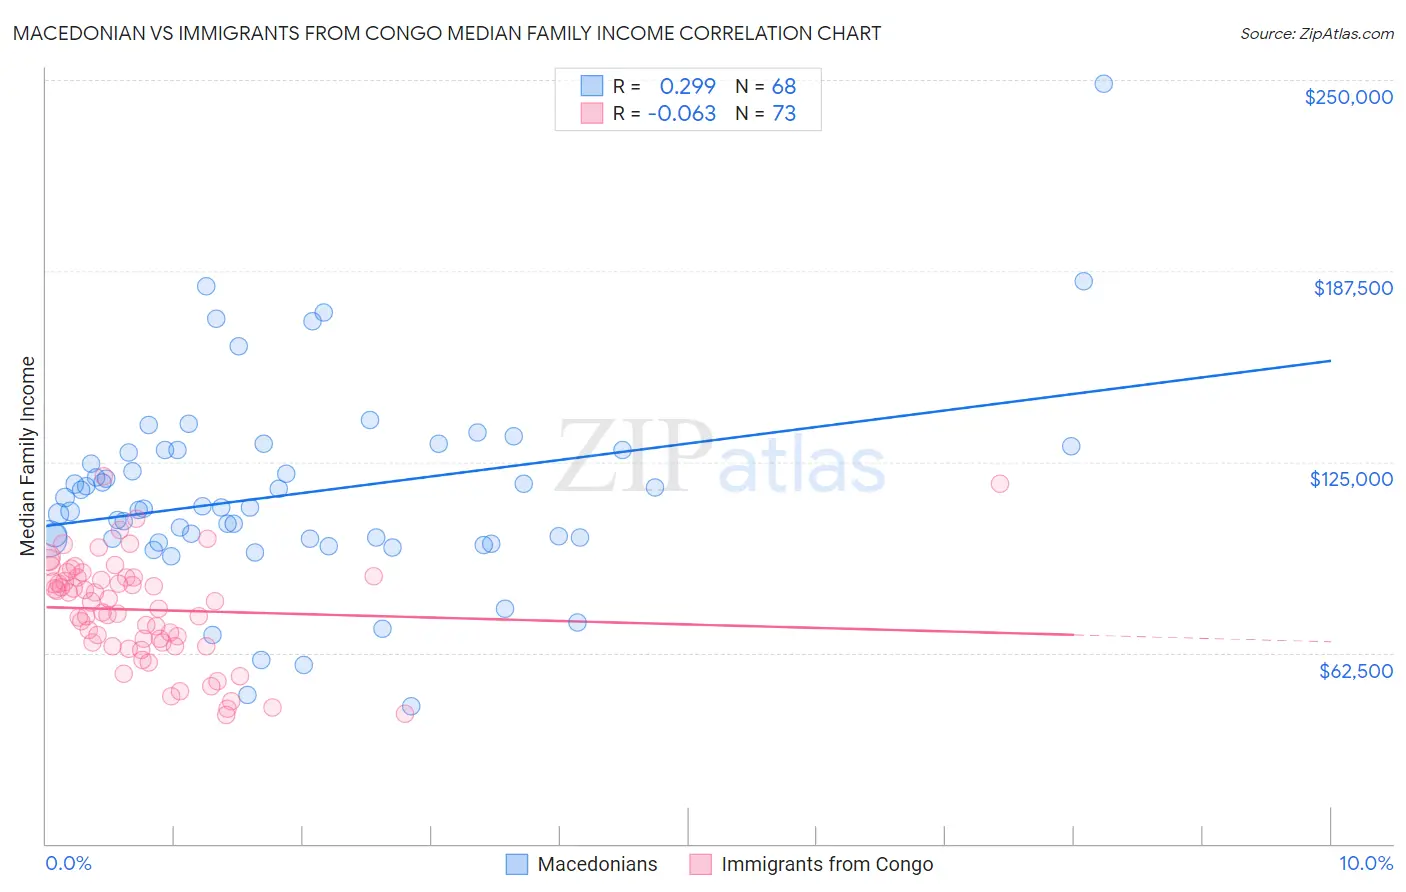
Macedonian vs Immigrants from Congo Median Family Income Correlation Chart
The statistical analysis conducted on geographies consisting of 132,508,539 people shows a weak positive correlation between the proportion of Macedonians and median family income in the United States with a correlation coefficient (R) of 0.299 and weighted average of $109,668. Similarly, the statistical analysis conducted on geographies consisting of 92,050,082 people shows a slight negative correlation between the proportion of Immigrants from Congo and median family income in the United States with a correlation coefficient (R) of -0.063 and weighted average of $82,216, a difference of 33.4%.
Median Family Income Correlation Summary
| Measurement | Macedonian | Immigrants from Congo |
| Minimum | $44,804 | $42,229 |
| Maximum | $248,750 | $120,257 |
| Range | $203,946 | $78,028 |
| Mean | $114,576 | $76,553 |
| Median | $110,196 | $79,188 |
| Interquartile 25% (IQ1) | $99,876 | $65,174 |
| Interquartile 75% (IQ3) | $128,750 | $87,165 |
| Interquartile Range (IQR) | $28,874 | $21,991 |
| Standard Deviation (Sample) | $32,654 | $17,096 |
| Standard Deviation (Population) | $32,413 | $16,978 |
Similar Demographics by Median Family Income
Demographics Similar to Macedonians by Median Family Income
In terms of median family income, the demographic groups most similar to Macedonians are Armenian ($109,692, a difference of 0.020%), Immigrants from Ukraine ($109,645, a difference of 0.020%), Assyrian/Chaldean/Syriac ($109,622, a difference of 0.040%), Immigrants from Kuwait ($109,731, a difference of 0.060%), and Jordanian ($109,865, a difference of 0.18%).
| Demographics | Rating | Rank | Median Family Income |
| Immigrants | Kazakhstan | 97.8 /100 | #93 | Exceptional $110,137 |
| Koreans | 97.8 /100 | #94 | Exceptional $110,103 |
| Zimbabweans | 97.7 /100 | #95 | Exceptional $110,011 |
| Immigrants | Moldova | 97.7 /100 | #96 | Exceptional $109,975 |
| Jordanians | 97.5 /100 | #97 | Exceptional $109,865 |
| Immigrants | Kuwait | 97.4 /100 | #98 | Exceptional $109,731 |
| Armenians | 97.3 /100 | #99 | Exceptional $109,692 |
| Macedonians | 97.3 /100 | #100 | Exceptional $109,668 |
| Immigrants | Ukraine | 97.2 /100 | #101 | Exceptional $109,645 |
| Assyrians/Chaldeans/Syriacs | 97.2 /100 | #102 | Exceptional $109,622 |
| Immigrants | Brazil | 96.9 /100 | #103 | Exceptional $109,418 |
| Palestinians | 96.9 /100 | #104 | Exceptional $109,413 |
| Syrians | 96.7 /100 | #105 | Exceptional $109,299 |
| Albanians | 96.4 /100 | #106 | Exceptional $109,136 |
| Immigrants | North Macedonia | 96.4 /100 | #107 | Exceptional $109,136 |
Demographics Similar to Immigrants from Congo by Median Family Income
In terms of median family income, the demographic groups most similar to Immigrants from Congo are Arapaho ($82,064, a difference of 0.19%), Sioux ($82,386, a difference of 0.21%), Black/African American ($81,912, a difference of 0.37%), Creek ($82,560, a difference of 0.42%), and Dutch West Indian ($81,852, a difference of 0.45%).
| Demographics | Rating | Rank | Median Family Income |
| Immigrants | Honduras | 0.0 /100 | #319 | Tragic $83,618 |
| Seminole | 0.0 /100 | #320 | Tragic $83,354 |
| Immigrants | Caribbean | 0.0 /100 | #321 | Tragic $83,319 |
| Dominicans | 0.0 /100 | #322 | Tragic $82,888 |
| Bahamians | 0.0 /100 | #323 | Tragic $82,631 |
| Creek | 0.0 /100 | #324 | Tragic $82,560 |
| Sioux | 0.0 /100 | #325 | Tragic $82,386 |
| Immigrants | Congo | 0.0 /100 | #326 | Tragic $82,216 |
| Arapaho | 0.0 /100 | #327 | Tragic $82,064 |
| Blacks/African Americans | 0.0 /100 | #328 | Tragic $81,912 |
| Dutch West Indians | 0.0 /100 | #329 | Tragic $81,852 |
| Cheyenne | 0.0 /100 | #330 | Tragic $81,385 |
| Immigrants | Dominican Republic | 0.0 /100 | #331 | Tragic $81,233 |
| Natives/Alaskans | 0.0 /100 | #332 | Tragic $80,908 |
| Kiowa | 0.0 /100 | #333 | Tragic $80,885 |