Macedonian vs Cypriot Median Family Income
COMPARE
Macedonian
Cypriot
Median Family Income
Median Family Income Comparison
Macedonians
Cypriots
$109,668
MEDIAN FAMILY INCOME
97.3/ 100
METRIC RATING
100th/ 347
METRIC RANK
$127,064
MEDIAN FAMILY INCOME
100.0/ 100
METRIC RATING
12th/ 347
METRIC RANK
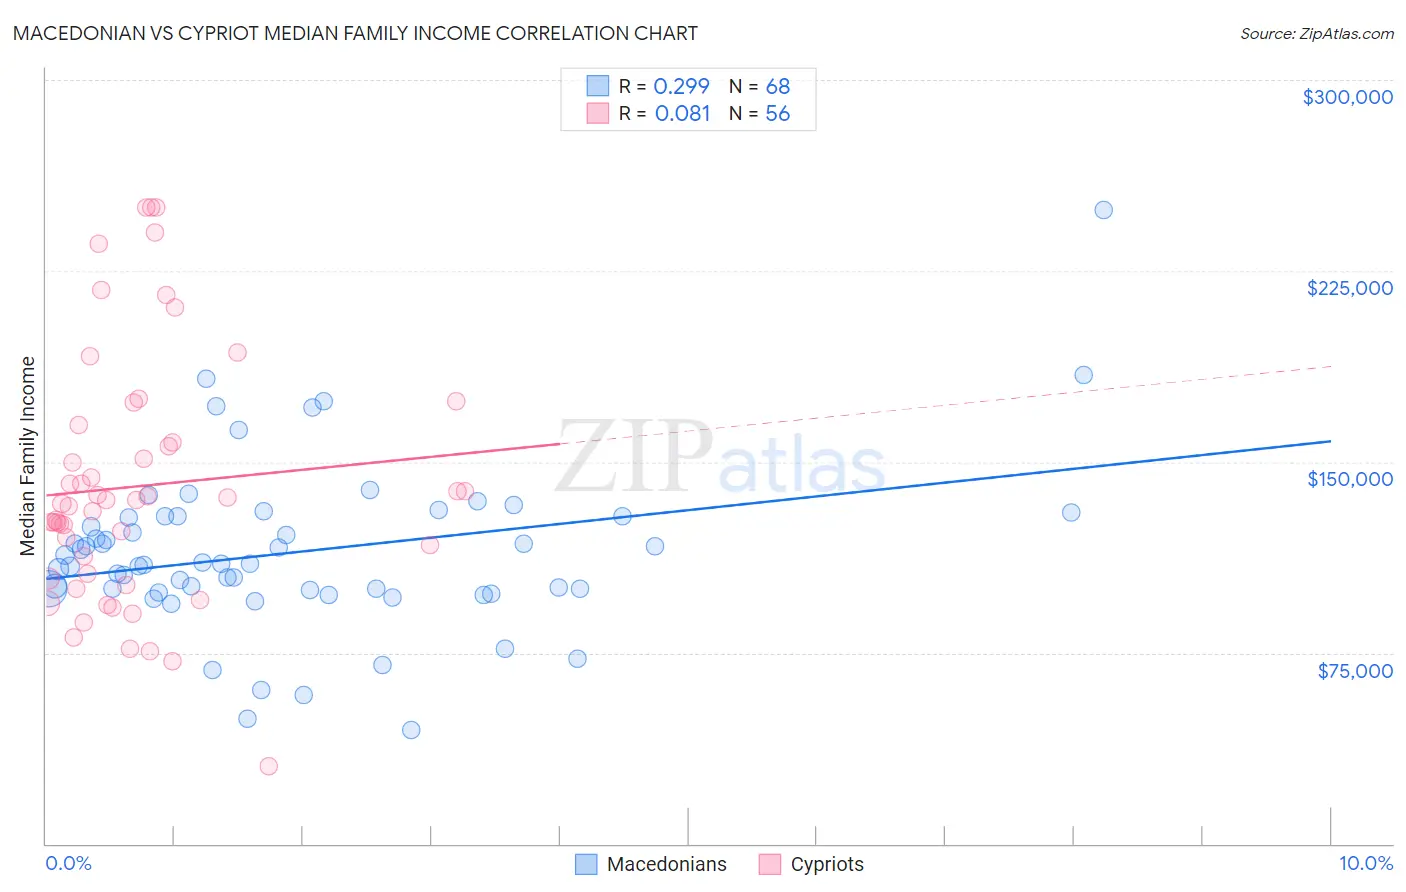
Macedonian vs Cypriot Median Family Income Correlation Chart
The statistical analysis conducted on geographies consisting of 132,508,539 people shows a weak positive correlation between the proportion of Macedonians and median family income in the United States with a correlation coefficient (R) of 0.299 and weighted average of $109,668. Similarly, the statistical analysis conducted on geographies consisting of 61,838,668 people shows a slight positive correlation between the proportion of Cypriots and median family income in the United States with a correlation coefficient (R) of 0.081 and weighted average of $127,064, a difference of 15.9%.
Median Family Income Correlation Summary
| Measurement | Macedonian | Cypriot |
| Minimum | $44,804 | $30,441 |
| Maximum | $248,750 | $250,001 |
| Range | $203,946 | $219,560 |
| Mean | $114,576 | $140,451 |
| Median | $110,196 | $134,246 |
| Interquartile 25% (IQ1) | $99,876 | $104,944 |
| Interquartile 75% (IQ3) | $128,750 | $161,047 |
| Interquartile Range (IQR) | $28,874 | $56,103 |
| Standard Deviation (Sample) | $32,654 | $49,252 |
| Standard Deviation (Population) | $32,413 | $48,811 |
Similar Demographics by Median Family Income
Demographics Similar to Macedonians by Median Family Income
In terms of median family income, the demographic groups most similar to Macedonians are Armenian ($109,692, a difference of 0.020%), Immigrants from Ukraine ($109,645, a difference of 0.020%), Assyrian/Chaldean/Syriac ($109,622, a difference of 0.040%), Immigrants from Kuwait ($109,731, a difference of 0.060%), and Jordanian ($109,865, a difference of 0.18%).
| Demographics | Rating | Rank | Median Family Income |
| Immigrants | Kazakhstan | 97.8 /100 | #93 | Exceptional $110,137 |
| Koreans | 97.8 /100 | #94 | Exceptional $110,103 |
| Zimbabweans | 97.7 /100 | #95 | Exceptional $110,011 |
| Immigrants | Moldova | 97.7 /100 | #96 | Exceptional $109,975 |
| Jordanians | 97.5 /100 | #97 | Exceptional $109,865 |
| Immigrants | Kuwait | 97.4 /100 | #98 | Exceptional $109,731 |
| Armenians | 97.3 /100 | #99 | Exceptional $109,692 |
| Macedonians | 97.3 /100 | #100 | Exceptional $109,668 |
| Immigrants | Ukraine | 97.2 /100 | #101 | Exceptional $109,645 |
| Assyrians/Chaldeans/Syriacs | 97.2 /100 | #102 | Exceptional $109,622 |
| Immigrants | Brazil | 96.9 /100 | #103 | Exceptional $109,418 |
| Palestinians | 96.9 /100 | #104 | Exceptional $109,413 |
| Syrians | 96.7 /100 | #105 | Exceptional $109,299 |
| Albanians | 96.4 /100 | #106 | Exceptional $109,136 |
| Immigrants | North Macedonia | 96.4 /100 | #107 | Exceptional $109,136 |
Demographics Similar to Cypriots by Median Family Income
In terms of median family income, the demographic groups most similar to Cypriots are Immigrants from Israel ($127,430, a difference of 0.29%), Immigrants from Australia ($126,620, a difference of 0.35%), Immigrants from Ireland ($127,584, a difference of 0.41%), Immigrants from South Central Asia ($125,956, a difference of 0.88%), and Eastern European ($125,546, a difference of 1.2%).
| Demographics | Rating | Rank | Median Family Income |
| Iranians | 100.0 /100 | #5 | Exceptional $133,839 |
| Thais | 100.0 /100 | #6 | Exceptional $131,281 |
| Immigrants | Hong Kong | 100.0 /100 | #7 | Exceptional $131,067 |
| Immigrants | Iran | 100.0 /100 | #8 | Exceptional $130,894 |
| Okinawans | 100.0 /100 | #9 | Exceptional $129,979 |
| Immigrants | Ireland | 100.0 /100 | #10 | Exceptional $127,584 |
| Immigrants | Israel | 100.0 /100 | #11 | Exceptional $127,430 |
| Cypriots | 100.0 /100 | #12 | Exceptional $127,064 |
| Immigrants | Australia | 100.0 /100 | #13 | Exceptional $126,620 |
| Immigrants | South Central Asia | 100.0 /100 | #14 | Exceptional $125,956 |
| Eastern Europeans | 100.0 /100 | #15 | Exceptional $125,546 |
| Immigrants | China | 100.0 /100 | #16 | Exceptional $125,540 |
| Indians (Asian) | 100.0 /100 | #17 | Exceptional $125,312 |
| Immigrants | Eastern Asia | 100.0 /100 | #18 | Exceptional $125,150 |
| Immigrants | Belgium | 100.0 /100 | #19 | Exceptional $123,831 |