Macedonian vs Immigrants from England Median Family Income
COMPARE
Macedonian
Immigrants from England
Median Family Income
Median Family Income Comparison
Macedonians
Immigrants from England
$109,668
MEDIAN FAMILY INCOME
97.3/ 100
METRIC RATING
100th/ 347
METRIC RANK
$112,038
MEDIAN FAMILY INCOME
99.2/ 100
METRIC RATING
82nd/ 347
METRIC RANK
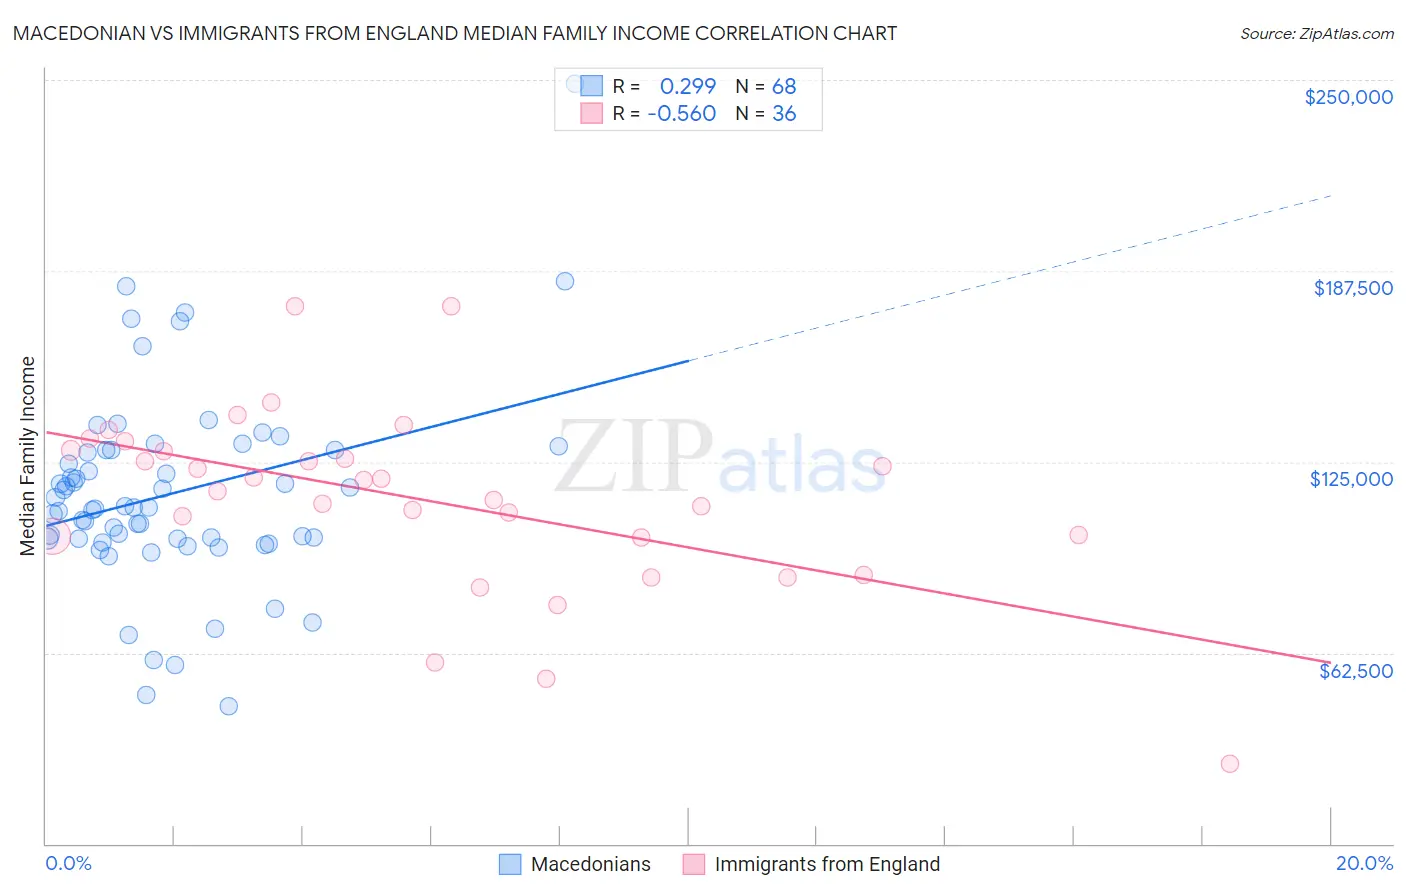
Macedonian vs Immigrants from England Median Family Income Correlation Chart
The statistical analysis conducted on geographies consisting of 132,508,539 people shows a weak positive correlation between the proportion of Macedonians and median family income in the United States with a correlation coefficient (R) of 0.299 and weighted average of $109,668. Similarly, the statistical analysis conducted on geographies consisting of 391,652,266 people shows a substantial negative correlation between the proportion of Immigrants from England and median family income in the United States with a correlation coefficient (R) of -0.560 and weighted average of $112,038, a difference of 2.2%.
Median Family Income Correlation Summary
| Measurement | Macedonian | Immigrants from England |
| Minimum | $44,804 | $26,250 |
| Maximum | $248,750 | $176,139 |
| Range | $203,946 | $149,889 |
| Mean | $114,576 | $112,548 |
| Median | $110,196 | $117,120 |
| Interquartile 25% (IQ1) | $99,876 | $100,437 |
| Interquartile 75% (IQ3) | $128,750 | $128,664 |
| Interquartile Range (IQR) | $28,874 | $28,227 |
| Standard Deviation (Sample) | $32,654 | $29,901 |
| Standard Deviation (Population) | $32,413 | $29,483 |
Demographics Similar to Macedonians and Immigrants from England by Median Family Income
In terms of median family income, the demographic groups most similar to Macedonians are Armenian ($109,692, a difference of 0.020%), Immigrants from Ukraine ($109,645, a difference of 0.020%), Immigrants from Kuwait ($109,731, a difference of 0.060%), Jordanian ($109,865, a difference of 0.18%), and Immigrants from Moldova ($109,975, a difference of 0.28%). Similarly, the demographic groups most similar to Immigrants from England are Immigrants from North America ($112,151, a difference of 0.10%), Immigrants from Egypt ($111,689, a difference of 0.31%), Immigrants from Hungary ($111,378, a difference of 0.59%), Croatian ($111,370, a difference of 0.60%), and Ukrainian ($111,368, a difference of 0.60%).
| Demographics | Rating | Rank | Median Family Income |
| Immigrants | North America | 99.2 /100 | #81 | Exceptional $112,151 |
| Immigrants | England | 99.2 /100 | #82 | Exceptional $112,038 |
| Immigrants | Egypt | 99.0 /100 | #83 | Exceptional $111,689 |
| Immigrants | Hungary | 98.8 /100 | #84 | Exceptional $111,378 |
| Croatians | 98.8 /100 | #85 | Exceptional $111,370 |
| Ukrainians | 98.8 /100 | #86 | Exceptional $111,368 |
| Austrians | 98.8 /100 | #87 | Exceptional $111,306 |
| Romanians | 98.8 /100 | #88 | Exceptional $111,243 |
| Immigrants | Argentina | 98.5 /100 | #89 | Exceptional $110,873 |
| Northern Europeans | 98.3 /100 | #90 | Exceptional $110,635 |
| Immigrants | Southern Europe | 98.3 /100 | #91 | Exceptional $110,614 |
| Immigrants | Lebanon | 97.9 /100 | #92 | Exceptional $110,159 |
| Immigrants | Kazakhstan | 97.8 /100 | #93 | Exceptional $110,137 |
| Koreans | 97.8 /100 | #94 | Exceptional $110,103 |
| Zimbabweans | 97.7 /100 | #95 | Exceptional $110,011 |
| Immigrants | Moldova | 97.7 /100 | #96 | Exceptional $109,975 |
| Jordanians | 97.5 /100 | #97 | Exceptional $109,865 |
| Immigrants | Kuwait | 97.4 /100 | #98 | Exceptional $109,731 |
| Armenians | 97.3 /100 | #99 | Exceptional $109,692 |
| Macedonians | 97.3 /100 | #100 | Exceptional $109,668 |
| Immigrants | Ukraine | 97.2 /100 | #101 | Exceptional $109,645 |