Macedonian vs Immigrants from Czechoslovakia Median Family Income
COMPARE
Macedonian
Immigrants from Czechoslovakia
Median Family Income
Median Family Income Comparison
Macedonians
Immigrants from Czechoslovakia
$109,668
MEDIAN FAMILY INCOME
97.3/ 100
METRIC RATING
100th/ 347
METRIC RANK
$116,165
MEDIAN FAMILY INCOME
99.9/ 100
METRIC RATING
50th/ 347
METRIC RANK
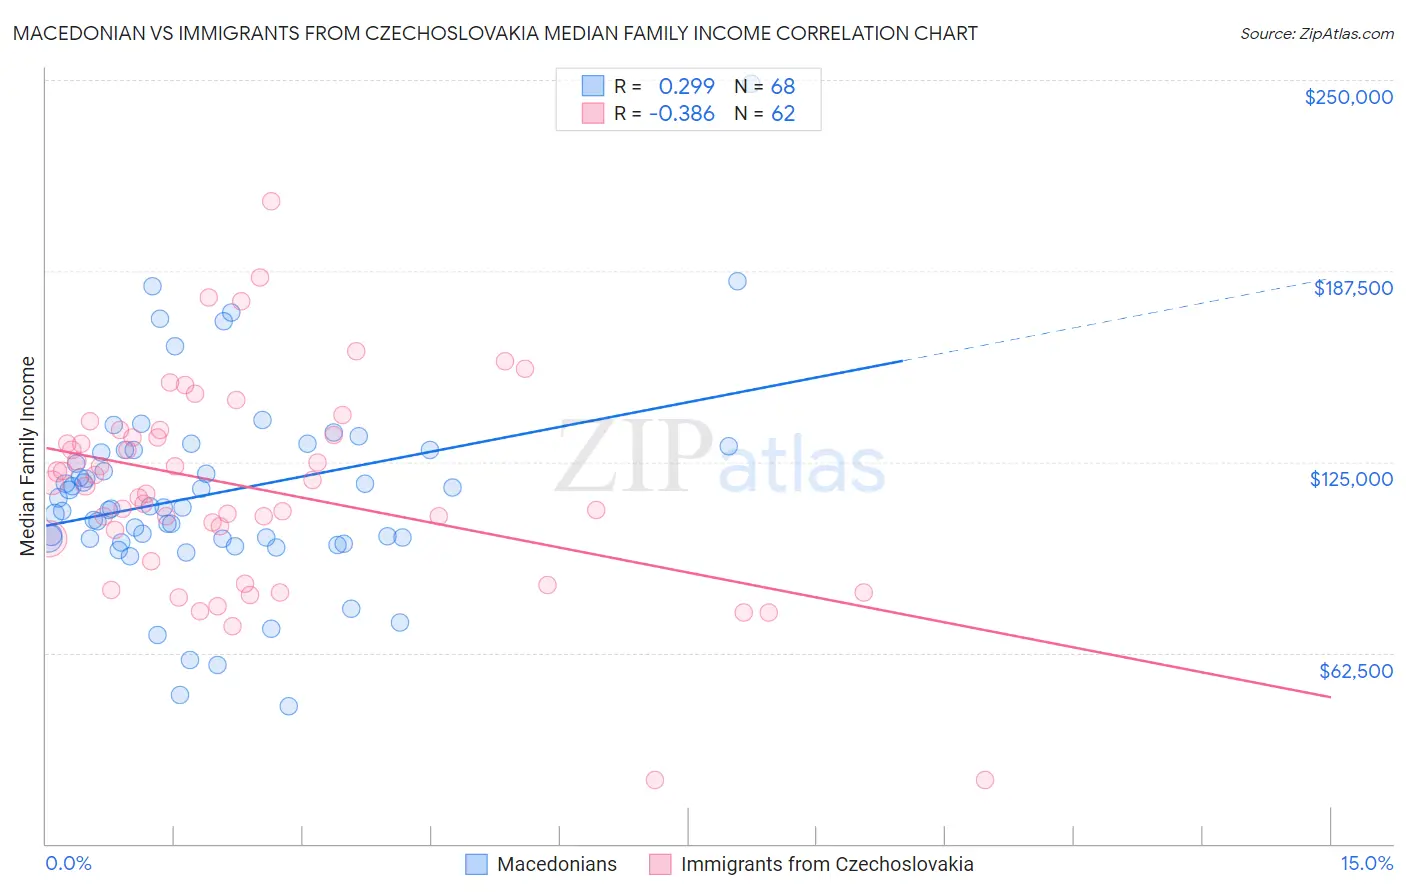
Macedonian vs Immigrants from Czechoslovakia Median Family Income Correlation Chart
The statistical analysis conducted on geographies consisting of 132,508,539 people shows a weak positive correlation between the proportion of Macedonians and median family income in the United States with a correlation coefficient (R) of 0.299 and weighted average of $109,668. Similarly, the statistical analysis conducted on geographies consisting of 195,434,997 people shows a mild negative correlation between the proportion of Immigrants from Czechoslovakia and median family income in the United States with a correlation coefficient (R) of -0.386 and weighted average of $116,165, a difference of 5.9%.
Median Family Income Correlation Summary
| Measurement | Macedonian | Immigrants from Czechoslovakia |
| Minimum | $44,804 | $20,761 |
| Maximum | $248,750 | $210,139 |
| Range | $203,946 | $189,378 |
| Mean | $114,576 | $116,278 |
| Median | $110,196 | $117,481 |
| Interquartile 25% (IQ1) | $99,876 | $99,688 |
| Interquartile 75% (IQ3) | $128,750 | $133,750 |
| Interquartile Range (IQR) | $28,874 | $34,062 |
| Standard Deviation (Sample) | $32,654 | $34,098 |
| Standard Deviation (Population) | $32,413 | $33,822 |
Similar Demographics by Median Family Income
Demographics Similar to Macedonians by Median Family Income
In terms of median family income, the demographic groups most similar to Macedonians are Armenian ($109,692, a difference of 0.020%), Immigrants from Ukraine ($109,645, a difference of 0.020%), Assyrian/Chaldean/Syriac ($109,622, a difference of 0.040%), Immigrants from Kuwait ($109,731, a difference of 0.060%), and Jordanian ($109,865, a difference of 0.18%).
| Demographics | Rating | Rank | Median Family Income |
| Immigrants | Kazakhstan | 97.8 /100 | #93 | Exceptional $110,137 |
| Koreans | 97.8 /100 | #94 | Exceptional $110,103 |
| Zimbabweans | 97.7 /100 | #95 | Exceptional $110,011 |
| Immigrants | Moldova | 97.7 /100 | #96 | Exceptional $109,975 |
| Jordanians | 97.5 /100 | #97 | Exceptional $109,865 |
| Immigrants | Kuwait | 97.4 /100 | #98 | Exceptional $109,731 |
| Armenians | 97.3 /100 | #99 | Exceptional $109,692 |
| Macedonians | 97.3 /100 | #100 | Exceptional $109,668 |
| Immigrants | Ukraine | 97.2 /100 | #101 | Exceptional $109,645 |
| Assyrians/Chaldeans/Syriacs | 97.2 /100 | #102 | Exceptional $109,622 |
| Immigrants | Brazil | 96.9 /100 | #103 | Exceptional $109,418 |
| Palestinians | 96.9 /100 | #104 | Exceptional $109,413 |
| Syrians | 96.7 /100 | #105 | Exceptional $109,299 |
| Albanians | 96.4 /100 | #106 | Exceptional $109,136 |
| Immigrants | North Macedonia | 96.4 /100 | #107 | Exceptional $109,136 |
Demographics Similar to Immigrants from Czechoslovakia by Median Family Income
In terms of median family income, the demographic groups most similar to Immigrants from Czechoslovakia are Chinese ($116,188, a difference of 0.020%), Immigrants from South Africa ($116,286, a difference of 0.10%), Immigrants from Malaysia ($115,880, a difference of 0.25%), Maltese ($115,862, a difference of 0.26%), and Immigrants from Norway ($115,847, a difference of 0.27%).
| Demographics | Rating | Rank | Median Family Income |
| Bulgarians | 100.0 /100 | #43 | Exceptional $117,818 |
| Cambodians | 100.0 /100 | #44 | Exceptional $117,780 |
| Immigrants | Greece | 99.9 /100 | #45 | Exceptional $117,344 |
| Immigrants | Russia | 99.9 /100 | #46 | Exceptional $116,942 |
| Immigrants | Austria | 99.9 /100 | #47 | Exceptional $116,830 |
| Immigrants | South Africa | 99.9 /100 | #48 | Exceptional $116,286 |
| Chinese | 99.9 /100 | #49 | Exceptional $116,188 |
| Immigrants | Czechoslovakia | 99.9 /100 | #50 | Exceptional $116,165 |
| Immigrants | Malaysia | 99.9 /100 | #51 | Exceptional $115,880 |
| Maltese | 99.9 /100 | #52 | Exceptional $115,862 |
| Immigrants | Norway | 99.9 /100 | #53 | Exceptional $115,847 |
| Immigrants | Europe | 99.9 /100 | #54 | Exceptional $115,523 |
| Lithuanians | 99.8 /100 | #55 | Exceptional $115,395 |
| New Zealanders | 99.8 /100 | #56 | Exceptional $115,230 |
| Greeks | 99.8 /100 | #57 | Exceptional $115,192 |