Macedonian vs Mexican American Indian Wage/Income Gap
COMPARE
Macedonian
Mexican American Indian
Wage/Income Gap
Wage/Income Gap Comparison
Macedonians
Mexican American Indians
28.6%
WAGE/INCOME GAP
0.1/ 100
METRIC RATING
309th/ 347
METRIC RANK
24.7%
WAGE/INCOME GAP
92.2/ 100
METRIC RATING
134th/ 347
METRIC RANK
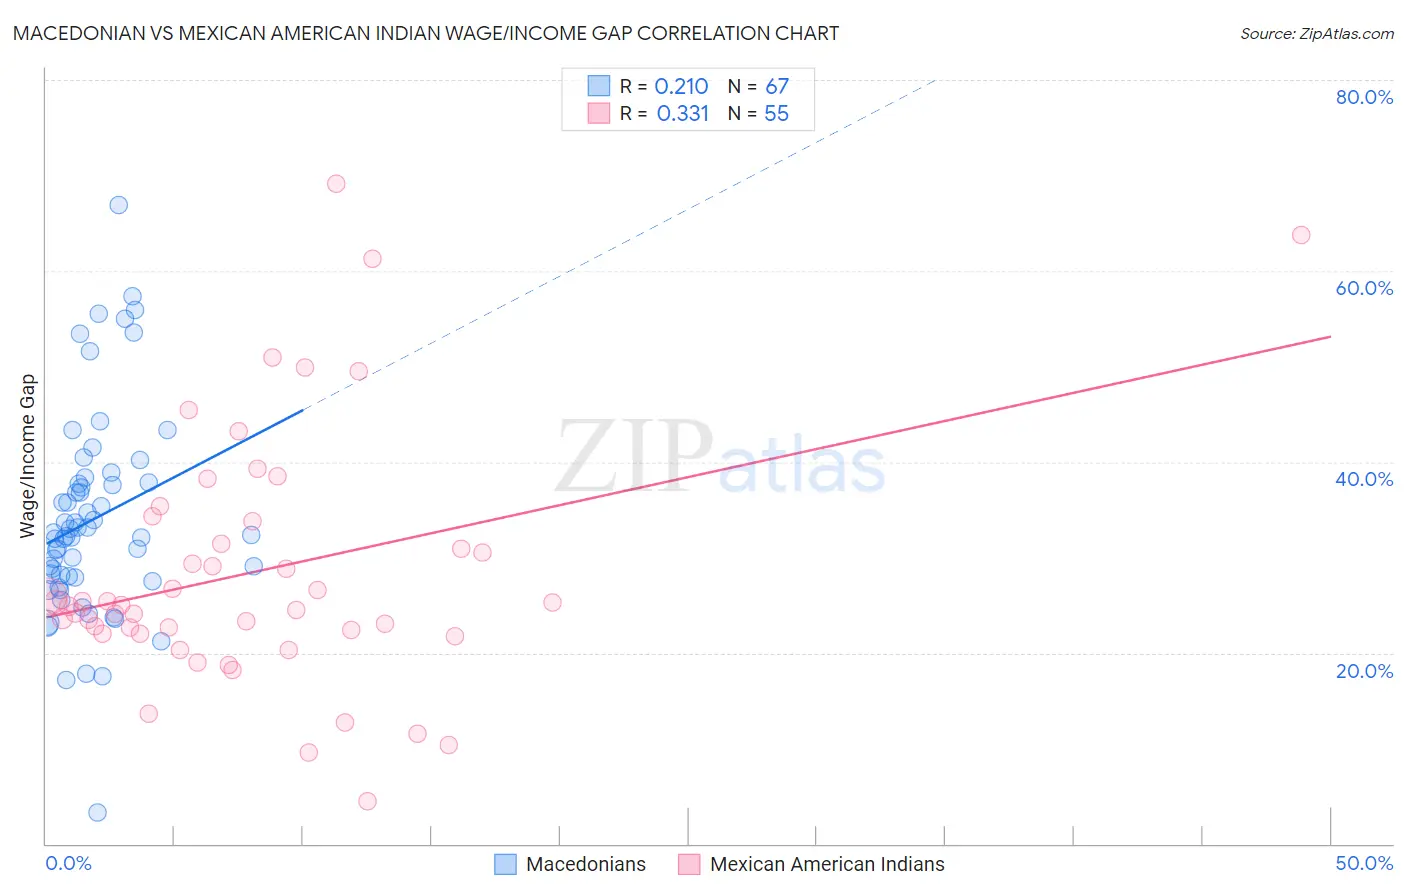
Macedonian vs Mexican American Indian Wage/Income Gap Correlation Chart
The statistical analysis conducted on geographies consisting of 132,645,129 people shows a weak positive correlation between the proportion of Macedonians and wage/income gap percentage in the United States with a correlation coefficient (R) of 0.210 and weighted average of 28.6%. Similarly, the statistical analysis conducted on geographies consisting of 317,413,111 people shows a mild positive correlation between the proportion of Mexican American Indians and wage/income gap percentage in the United States with a correlation coefficient (R) of 0.331 and weighted average of 24.7%, a difference of 15.5%.
Wage/Income Gap Correlation Summary
| Measurement | Macedonian | Mexican American Indian |
| Minimum | 3.2% | 4.5% |
| Maximum | 67.0% | 69.1% |
| Range | 63.7% | 64.7% |
| Mean | 33.9% | 28.5% |
| Median | 32.4% | 25.0% |
| Interquartile 25% (IQ1) | 27.9% | 22.0% |
| Interquartile 75% (IQ3) | 37.9% | 33.7% |
| Interquartile Range (IQR) | 10.0% | 11.7% |
| Standard Deviation (Sample) | 10.8% | 13.1% |
| Standard Deviation (Population) | 10.8% | 13.0% |
Similar Demographics by Wage/Income Gap
Demographics Similar to Macedonians by Wage/Income Gap
In terms of wage/income gap, the demographic groups most similar to Macedonians are Polish (28.5%, a difference of 0.090%), Finnish (28.6%, a difference of 0.090%), Immigrants from Denmark (28.5%, a difference of 0.16%), Immigrants from Lithuania (28.6%, a difference of 0.16%), and White/Caucasian (28.5%, a difference of 0.17%).
| Demographics | Rating | Rank | Wage/Income Gap |
| Scotch-Irish | 0.2 /100 | #302 | Tragic 28.5% |
| Irish | 0.2 /100 | #303 | Tragic 28.5% |
| Immigrants | Netherlands | 0.2 /100 | #304 | Tragic 28.5% |
| Immigrants | South Africa | 0.1 /100 | #305 | Tragic 28.5% |
| Whites/Caucasians | 0.1 /100 | #306 | Tragic 28.5% |
| Immigrants | Denmark | 0.1 /100 | #307 | Tragic 28.5% |
| Poles | 0.1 /100 | #308 | Tragic 28.5% |
| Macedonians | 0.1 /100 | #309 | Tragic 28.6% |
| Finns | 0.1 /100 | #310 | Tragic 28.6% |
| Immigrants | Lithuania | 0.1 /100 | #311 | Tragic 28.6% |
| Eastern Europeans | 0.1 /100 | #312 | Tragic 28.6% |
| French | 0.1 /100 | #313 | Tragic 28.7% |
| Immigrants | Scotland | 0.1 /100 | #314 | Tragic 28.7% |
| Maltese | 0.1 /100 | #315 | Tragic 28.7% |
| Lithuanians | 0.1 /100 | #316 | Tragic 28.7% |
Demographics Similar to Mexican American Indians by Wage/Income Gap
In terms of wage/income gap, the demographic groups most similar to Mexican American Indians are Colombian (24.7%, a difference of 0.030%), Immigrants from Costa Rica (24.7%, a difference of 0.040%), South American Indian (24.7%, a difference of 0.060%), Immigrants from Philippines (24.7%, a difference of 0.19%), and Armenian (24.8%, a difference of 0.20%).
| Demographics | Rating | Rank | Wage/Income Gap |
| German Russians | 93.7 /100 | #127 | Exceptional 24.6% |
| Immigrants | Central America | 93.5 /100 | #128 | Exceptional 24.6% |
| Yup'ik | 93.3 /100 | #129 | Exceptional 24.7% |
| Alsatians | 93.2 /100 | #130 | Exceptional 24.7% |
| Immigrants | Philippines | 93.0 /100 | #131 | Exceptional 24.7% |
| Immigrants | Costa Rica | 92.4 /100 | #132 | Exceptional 24.7% |
| Colombians | 92.4 /100 | #133 | Exceptional 24.7% |
| Mexican American Indians | 92.2 /100 | #134 | Exceptional 24.7% |
| South American Indians | 92.0 /100 | #135 | Exceptional 24.7% |
| Armenians | 91.3 /100 | #136 | Exceptional 24.8% |
| Immigrants | South Eastern Asia | 90.9 /100 | #137 | Exceptional 24.8% |
| Immigrants | Bosnia and Herzegovina | 90.1 /100 | #138 | Exceptional 24.8% |
| Hispanics or Latinos | 89.5 /100 | #139 | Excellent 24.9% |
| Immigrants | Nepal | 89.3 /100 | #140 | Excellent 24.9% |
| Hawaiians | 89.3 /100 | #141 | Excellent 24.9% |