Macedonian vs Comanche Per Capita Income
COMPARE
Macedonian
Comanche
Per Capita Income
Per Capita Income Comparison
Macedonians
Comanche
$47,573
PER CAPITA INCOME
98.8/ 100
METRIC RATING
91st/ 347
METRIC RANK
$38,088
PER CAPITA INCOME
0.2/ 100
METRIC RATING
277th/ 347
METRIC RANK
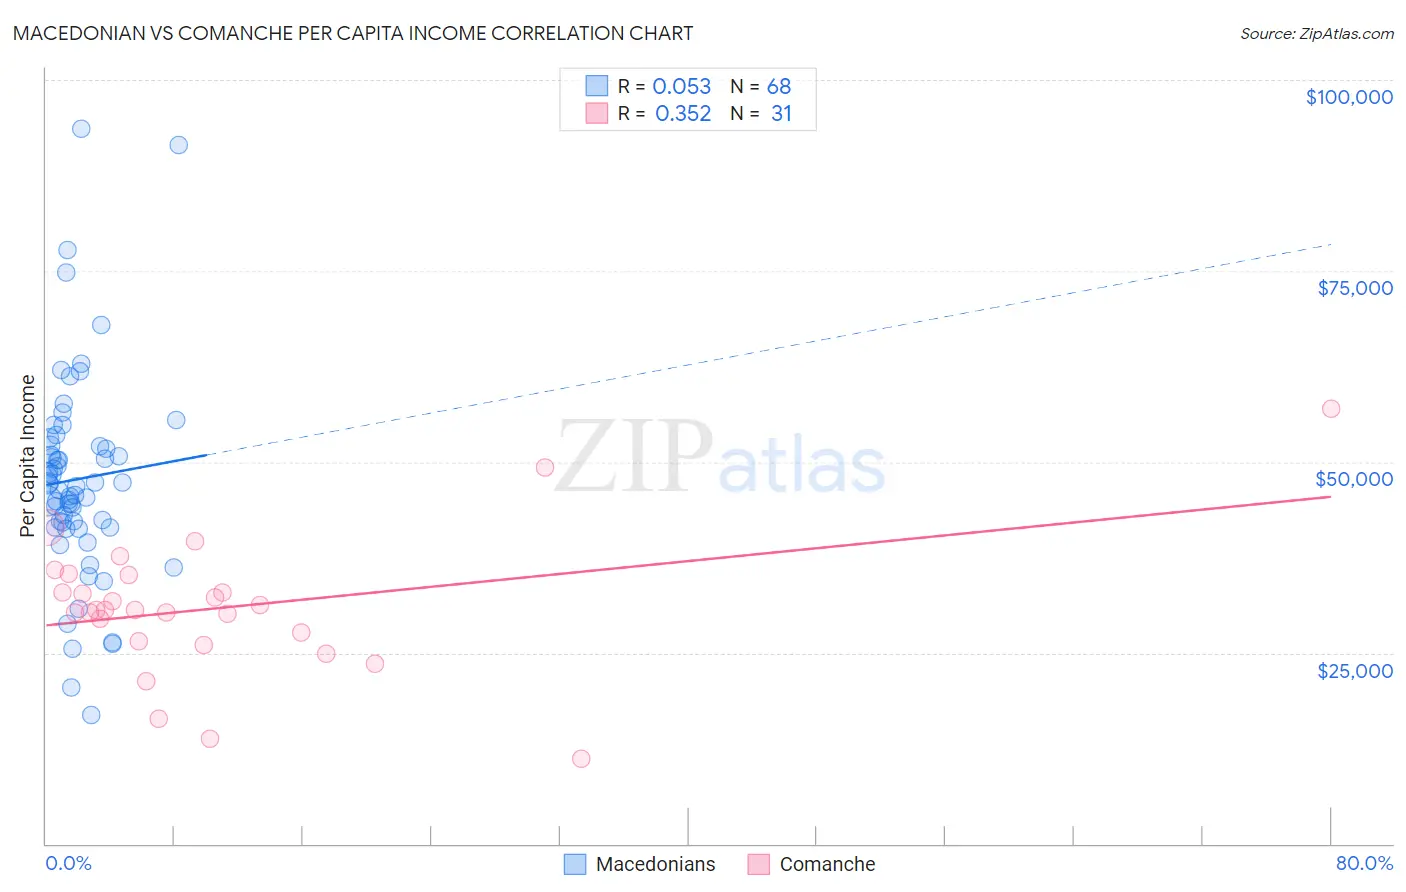
Macedonian vs Comanche Per Capita Income Correlation Chart
The statistical analysis conducted on geographies consisting of 132,587,632 people shows a slight positive correlation between the proportion of Macedonians and per capita income in the United States with a correlation coefficient (R) of 0.053 and weighted average of $47,573. Similarly, the statistical analysis conducted on geographies consisting of 109,786,530 people shows a mild positive correlation between the proportion of Comanche and per capita income in the United States with a correlation coefficient (R) of 0.352 and weighted average of $38,088, a difference of 24.9%.
Per Capita Income Correlation Summary
| Measurement | Macedonian | Comanche |
| Minimum | $16,916 | $11,178 |
| Maximum | $93,662 | $56,980 |
| Range | $76,746 | $45,802 |
| Mean | $47,728 | $30,910 |
| Median | $46,977 | $30,680 |
| Interquartile 25% (IQ1) | $41,808 | $26,547 |
| Interquartile 75% (IQ3) | $52,108 | $35,132 |
| Interquartile Range (IQR) | $10,300 | $8,585 |
| Standard Deviation (Sample) | $13,530 | $9,053 |
| Standard Deviation (Population) | $13,431 | $8,906 |
Similar Demographics by Per Capita Income
Demographics Similar to Macedonians by Per Capita Income
In terms of per capita income, the demographic groups most similar to Macedonians are Italian ($47,574, a difference of 0.0%), Immigrants from Moldova ($47,489, a difference of 0.18%), Northern European ($47,698, a difference of 0.26%), Croatian ($47,742, a difference of 0.36%), and Immigrants from Zimbabwe ($47,394, a difference of 0.38%).
| Demographics | Rating | Rank | Per Capita Income |
| Immigrants | Ukraine | 99.3 /100 | #84 | Exceptional $48,134 |
| Austrians | 99.3 /100 | #85 | Exceptional $48,116 |
| Immigrants | Southern Europe | 99.3 /100 | #86 | Exceptional $48,027 |
| Ukrainians | 99.3 /100 | #87 | Exceptional $48,014 |
| Croatians | 99.0 /100 | #88 | Exceptional $47,742 |
| Northern Europeans | 98.9 /100 | #89 | Exceptional $47,698 |
| Italians | 98.8 /100 | #90 | Exceptional $47,574 |
| Macedonians | 98.8 /100 | #91 | Exceptional $47,573 |
| Immigrants | Moldova | 98.7 /100 | #92 | Exceptional $47,489 |
| Immigrants | Zimbabwe | 98.5 /100 | #93 | Exceptional $47,394 |
| Albanians | 98.5 /100 | #94 | Exceptional $47,379 |
| Immigrants | Egypt | 98.5 /100 | #95 | Exceptional $47,361 |
| Alsatians | 98.3 /100 | #96 | Exceptional $47,284 |
| Carpatho Rusyns | 98.2 /100 | #97 | Exceptional $47,248 |
| Immigrants | Pakistan | 97.9 /100 | #98 | Exceptional $47,084 |
Demographics Similar to Comanche by Per Capita Income
In terms of per capita income, the demographic groups most similar to Comanche are Immigrants from Nicaragua ($38,065, a difference of 0.060%), Hmong ($38,120, a difference of 0.080%), Colville ($38,047, a difference of 0.11%), Potawatomi ($38,046, a difference of 0.11%), and Immigrants from Liberia ($38,165, a difference of 0.20%).
| Demographics | Rating | Rank | Per Capita Income |
| Immigrants | Belize | 0.3 /100 | #270 | Tragic $38,614 |
| Central Americans | 0.3 /100 | #271 | Tragic $38,560 |
| Immigrants | Cabo Verde | 0.3 /100 | #272 | Tragic $38,540 |
| Nepalese | 0.3 /100 | #273 | Tragic $38,442 |
| Immigrants | El Salvador | 0.3 /100 | #274 | Tragic $38,394 |
| Immigrants | Liberia | 0.2 /100 | #275 | Tragic $38,165 |
| Hmong | 0.2 /100 | #276 | Tragic $38,120 |
| Comanche | 0.2 /100 | #277 | Tragic $38,088 |
| Immigrants | Nicaragua | 0.2 /100 | #278 | Tragic $38,065 |
| Colville | 0.2 /100 | #279 | Tragic $38,047 |
| Potawatomi | 0.2 /100 | #280 | Tragic $38,046 |
| Immigrants | Dominica | 0.2 /100 | #281 | Tragic $37,952 |
| Immigrants | Laos | 0.1 /100 | #282 | Tragic $37,857 |
| Pennsylvania Germans | 0.1 /100 | #283 | Tragic $37,842 |
| Africans | 0.1 /100 | #284 | Tragic $37,785 |