Macedonian vs Ecuadorian Per Capita Income
COMPARE
Macedonian
Ecuadorian
Per Capita Income
Per Capita Income Comparison
Macedonians
Ecuadorians
$47,573
PER CAPITA INCOME
98.8/ 100
METRIC RATING
91st/ 347
METRIC RANK
$41,958
PER CAPITA INCOME
12.9/ 100
METRIC RATING
210th/ 347
METRIC RANK
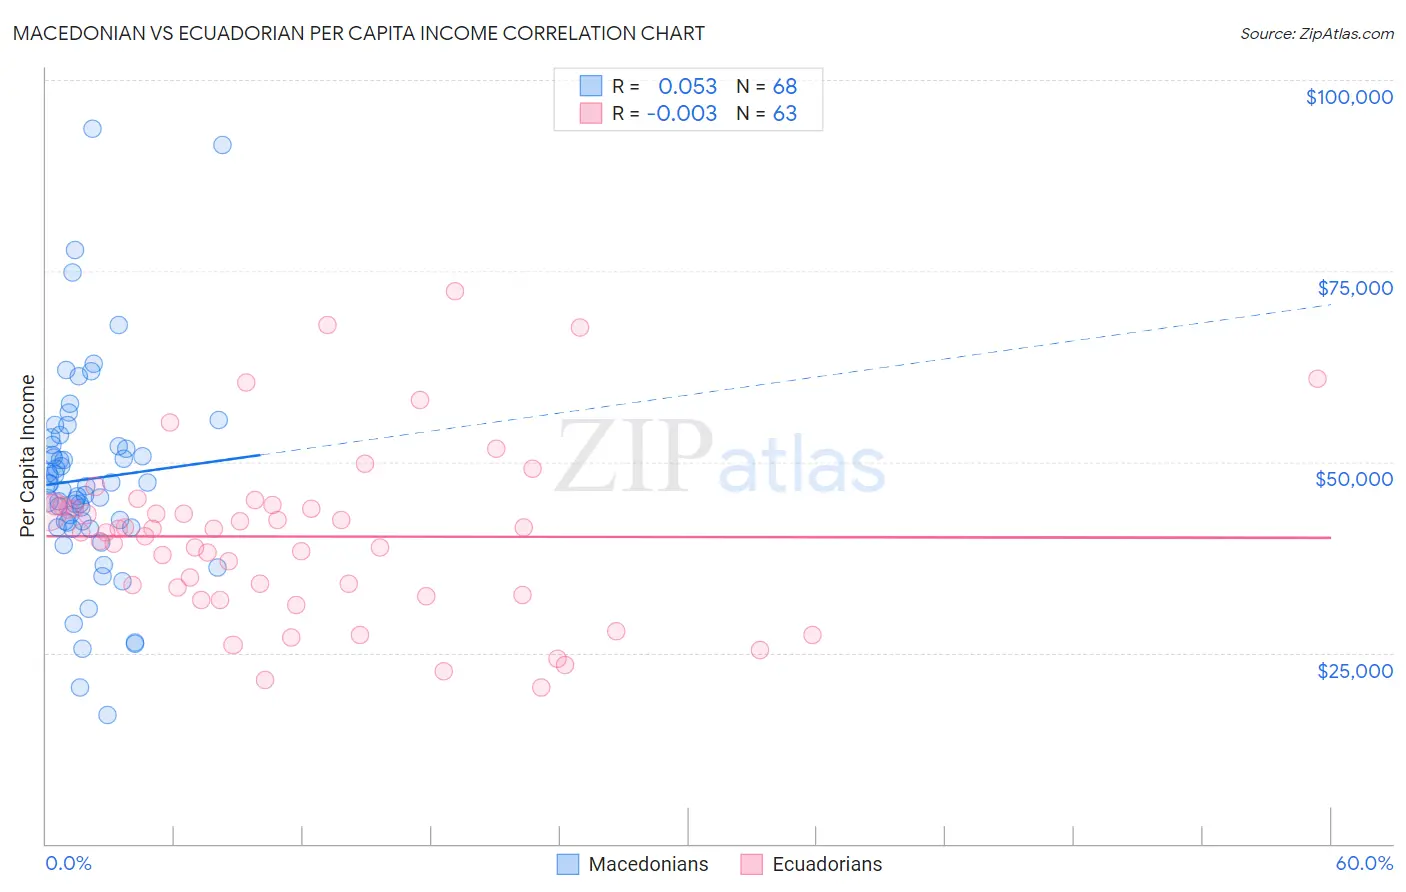
Macedonian vs Ecuadorian Per Capita Income Correlation Chart
The statistical analysis conducted on geographies consisting of 132,587,632 people shows a slight positive correlation between the proportion of Macedonians and per capita income in the United States with a correlation coefficient (R) of 0.053 and weighted average of $47,573. Similarly, the statistical analysis conducted on geographies consisting of 317,868,656 people shows no correlation between the proportion of Ecuadorians and per capita income in the United States with a correlation coefficient (R) of -0.003 and weighted average of $41,958, a difference of 13.4%.
Per Capita Income Correlation Summary
| Measurement | Macedonian | Ecuadorian |
| Minimum | $16,916 | $20,380 |
| Maximum | $93,662 | $72,406 |
| Range | $76,746 | $52,026 |
| Mean | $47,728 | $40,218 |
| Median | $46,977 | $40,771 |
| Interquartile 25% (IQ1) | $41,808 | $32,581 |
| Interquartile 75% (IQ3) | $52,108 | $44,161 |
| Interquartile Range (IQR) | $10,300 | $11,580 |
| Standard Deviation (Sample) | $13,530 | $11,145 |
| Standard Deviation (Population) | $13,431 | $11,056 |
Similar Demographics by Per Capita Income
Demographics Similar to Macedonians by Per Capita Income
In terms of per capita income, the demographic groups most similar to Macedonians are Italian ($47,574, a difference of 0.0%), Immigrants from Moldova ($47,489, a difference of 0.18%), Northern European ($47,698, a difference of 0.26%), Croatian ($47,742, a difference of 0.36%), and Immigrants from Zimbabwe ($47,394, a difference of 0.38%).
| Demographics | Rating | Rank | Per Capita Income |
| Immigrants | Ukraine | 99.3 /100 | #84 | Exceptional $48,134 |
| Austrians | 99.3 /100 | #85 | Exceptional $48,116 |
| Immigrants | Southern Europe | 99.3 /100 | #86 | Exceptional $48,027 |
| Ukrainians | 99.3 /100 | #87 | Exceptional $48,014 |
| Croatians | 99.0 /100 | #88 | Exceptional $47,742 |
| Northern Europeans | 98.9 /100 | #89 | Exceptional $47,698 |
| Italians | 98.8 /100 | #90 | Exceptional $47,574 |
| Macedonians | 98.8 /100 | #91 | Exceptional $47,573 |
| Immigrants | Moldova | 98.7 /100 | #92 | Exceptional $47,489 |
| Immigrants | Zimbabwe | 98.5 /100 | #93 | Exceptional $47,394 |
| Albanians | 98.5 /100 | #94 | Exceptional $47,379 |
| Immigrants | Egypt | 98.5 /100 | #95 | Exceptional $47,361 |
| Alsatians | 98.3 /100 | #96 | Exceptional $47,284 |
| Carpatho Rusyns | 98.2 /100 | #97 | Exceptional $47,248 |
| Immigrants | Pakistan | 97.9 /100 | #98 | Exceptional $47,084 |
Demographics Similar to Ecuadorians by Per Capita Income
In terms of per capita income, the demographic groups most similar to Ecuadorians are Immigrants from Sudan ($41,986, a difference of 0.070%), Panamanian ($42,035, a difference of 0.18%), Immigrants from Panama ($41,853, a difference of 0.25%), Venezuelan ($42,074, a difference of 0.28%), and Immigrants from Senegal ($41,830, a difference of 0.30%).
| Demographics | Rating | Rank | Per Capita Income |
| Spanish | 17.0 /100 | #203 | Poor $42,249 |
| Aleuts | 16.4 /100 | #204 | Poor $42,210 |
| Whites/Caucasians | 15.9 /100 | #205 | Poor $42,180 |
| Ghanaians | 15.7 /100 | #206 | Poor $42,164 |
| Venezuelans | 14.4 /100 | #207 | Poor $42,074 |
| Panamanians | 13.9 /100 | #208 | Poor $42,035 |
| Immigrants | Sudan | 13.2 /100 | #209 | Poor $41,986 |
| Ecuadorians | 12.9 /100 | #210 | Poor $41,958 |
| Immigrants | Panama | 11.6 /100 | #211 | Poor $41,853 |
| Immigrants | Senegal | 11.3 /100 | #212 | Poor $41,830 |
| Immigrants | Venezuela | 10.2 /100 | #213 | Poor $41,727 |
| Immigrants | Bangladesh | 10.1 /100 | #214 | Poor $41,709 |
| Sudanese | 9.9 /100 | #215 | Tragic $41,695 |
| Tongans | 9.9 /100 | #216 | Tragic $41,693 |
| Guamanians/Chamorros | 9.7 /100 | #217 | Tragic $41,678 |