Macedonian vs U.S. Virgin Islander Per Capita Income
COMPARE
Macedonian
U.S. Virgin Islander
Per Capita Income
Per Capita Income Comparison
Macedonians
U.S. Virgin Islanders
$47,573
PER CAPITA INCOME
98.8/ 100
METRIC RATING
91st/ 347
METRIC RANK
$37,589
PER CAPITA INCOME
0.1/ 100
METRIC RATING
289th/ 347
METRIC RANK
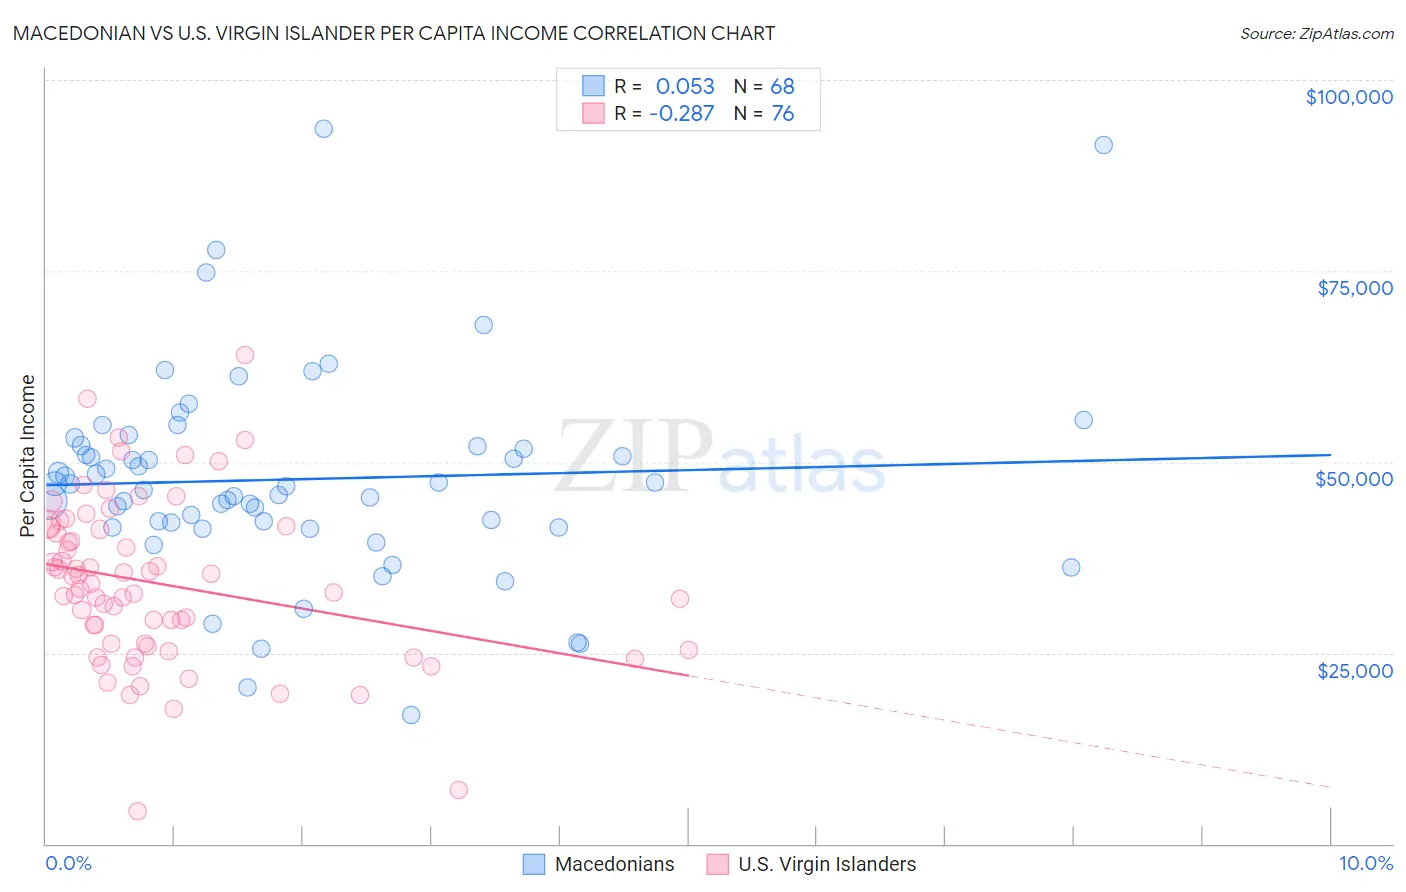
Macedonian vs U.S. Virgin Islander Per Capita Income Correlation Chart
The statistical analysis conducted on geographies consisting of 132,587,632 people shows a slight positive correlation between the proportion of Macedonians and per capita income in the United States with a correlation coefficient (R) of 0.053 and weighted average of $47,573. Similarly, the statistical analysis conducted on geographies consisting of 87,529,979 people shows a weak negative correlation between the proportion of U.S. Virgin Islanders and per capita income in the United States with a correlation coefficient (R) of -0.287 and weighted average of $37,589, a difference of 26.6%.
Per Capita Income Correlation Summary
| Measurement | Macedonian | U.S. Virgin Islander |
| Minimum | $16,916 | $4,326 |
| Maximum | $93,662 | $64,008 |
| Range | $76,746 | $59,682 |
| Mean | $47,728 | $34,023 |
| Median | $46,977 | $33,782 |
| Interquartile 25% (IQ1) | $41,808 | $26,044 |
| Interquartile 75% (IQ3) | $52,108 | $41,286 |
| Interquartile Range (IQR) | $10,300 | $15,242 |
| Standard Deviation (Sample) | $13,530 | $10,800 |
| Standard Deviation (Population) | $13,431 | $10,729 |
Similar Demographics by Per Capita Income
Demographics Similar to Macedonians by Per Capita Income
In terms of per capita income, the demographic groups most similar to Macedonians are Italian ($47,574, a difference of 0.0%), Immigrants from Moldova ($47,489, a difference of 0.18%), Northern European ($47,698, a difference of 0.26%), Croatian ($47,742, a difference of 0.36%), and Immigrants from Zimbabwe ($47,394, a difference of 0.38%).
| Demographics | Rating | Rank | Per Capita Income |
| Immigrants | Ukraine | 99.3 /100 | #84 | Exceptional $48,134 |
| Austrians | 99.3 /100 | #85 | Exceptional $48,116 |
| Immigrants | Southern Europe | 99.3 /100 | #86 | Exceptional $48,027 |
| Ukrainians | 99.3 /100 | #87 | Exceptional $48,014 |
| Croatians | 99.0 /100 | #88 | Exceptional $47,742 |
| Northern Europeans | 98.9 /100 | #89 | Exceptional $47,698 |
| Italians | 98.8 /100 | #90 | Exceptional $47,574 |
| Macedonians | 98.8 /100 | #91 | Exceptional $47,573 |
| Immigrants | Moldova | 98.7 /100 | #92 | Exceptional $47,489 |
| Immigrants | Zimbabwe | 98.5 /100 | #93 | Exceptional $47,394 |
| Albanians | 98.5 /100 | #94 | Exceptional $47,379 |
| Immigrants | Egypt | 98.5 /100 | #95 | Exceptional $47,361 |
| Alsatians | 98.3 /100 | #96 | Exceptional $47,284 |
| Carpatho Rusyns | 98.2 /100 | #97 | Exceptional $47,248 |
| Immigrants | Pakistan | 97.9 /100 | #98 | Exceptional $47,084 |
Demographics Similar to U.S. Virgin Islanders by Per Capita Income
In terms of per capita income, the demographic groups most similar to U.S. Virgin Islanders are Immigrants from Guatemala ($37,550, a difference of 0.10%), Cajun ($37,527, a difference of 0.16%), Blackfeet ($37,695, a difference of 0.28%), Central American Indian ($37,699, a difference of 0.29%), and Dominican ($37,697, a difference of 0.29%).
| Demographics | Rating | Rank | Per Capita Income |
| Immigrants | Laos | 0.1 /100 | #282 | Tragic $37,857 |
| Pennsylvania Germans | 0.1 /100 | #283 | Tragic $37,842 |
| Africans | 0.1 /100 | #284 | Tragic $37,785 |
| Guatemalans | 0.1 /100 | #285 | Tragic $37,766 |
| Central American Indians | 0.1 /100 | #286 | Tragic $37,699 |
| Dominicans | 0.1 /100 | #287 | Tragic $37,697 |
| Blackfeet | 0.1 /100 | #288 | Tragic $37,695 |
| U.S. Virgin Islanders | 0.1 /100 | #289 | Tragic $37,589 |
| Immigrants | Guatemala | 0.1 /100 | #290 | Tragic $37,550 |
| Cajuns | 0.1 /100 | #291 | Tragic $37,527 |
| Immigrants | Micronesia | 0.1 /100 | #292 | Tragic $37,464 |
| Mexican American Indians | 0.1 /100 | #293 | Tragic $37,407 |
| Cubans | 0.1 /100 | #294 | Tragic $37,383 |
| Immigrants | Dominican Republic | 0.1 /100 | #295 | Tragic $37,306 |
| Indonesians | 0.1 /100 | #296 | Tragic $37,300 |